Liquidity Pressure Structure
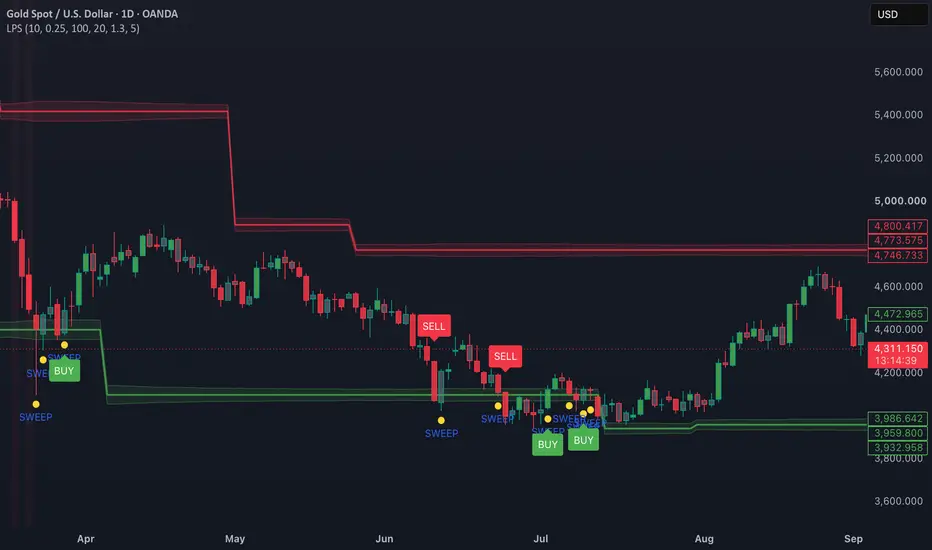
Liquidity Pressure Structure transforms liquidity and price behavior into a visual framework for understanding how price interacts with potential liquidity zones.
The indicator identifies recent swing-based liquidity areas and monitors how price behaves when approaching, sweeping, rejecting, or breaking those zones. Directional pressure and volume expansion are then used to highlight potential BUY or SELL conditions.
Key visual elements include:
Liquidity Zones — highlights areas around recent swing highs and lows where liquidity may be concentrated.
Liquidity Sweeps — identifies when price moves beyond a liquidity level and closes back through it, highlighting a potential sweep.
Directional Pressure — visualizes whether bullish or bearish pressure is becoming dominant around liquidity.
Volume Expansion — helps identify stronger participation when price interacts with important liquidity areas.
BUY / SELL Signals — highlights potential directional conditions when liquidity interaction and pressure align.
Pressure Visualization — uses the chart itself to make shifts between bullish and bearish pressure easier to recognize.
The framework is designed to answer a simple question:
What happens when price reaches liquidity?
Price may sweep a liquidity area and reject it, or break through it with stronger pressure and participation. By combining these behaviors into one visual structure, the indicator helps traders study liquidity interaction rather than relying on isolated price levels.
Use the signals as a contextual tool alongside price action, market structure, and other technical analysis. Liquidity levels are derived from historical price structure and do not represent confirmed institutional orders or guaranteed future price behavior.
The indicator identifies recent swing-based liquidity areas and monitors how price behaves when approaching, sweeping, rejecting, or breaking those zones. Directional pressure and volume expansion are then used to highlight potential BUY or SELL conditions.
Key visual elements include:
Liquidity Zones — highlights areas around recent swing highs and lows where liquidity may be concentrated.
Liquidity Sweeps — identifies when price moves beyond a liquidity level and closes back through it, highlighting a potential sweep.
Directional Pressure — visualizes whether bullish or bearish pressure is becoming dominant around liquidity.
Volume Expansion — helps identify stronger participation when price interacts with important liquidity areas.
BUY / SELL Signals — highlights potential directional conditions when liquidity interaction and pressure align.
Pressure Visualization — uses the chart itself to make shifts between bullish and bearish pressure easier to recognize.
The framework is designed to answer a simple question:
What happens when price reaches liquidity?
Price may sweep a liquidity area and reject it, or break through it with stronger pressure and participation. By combining these behaviors into one visual structure, the indicator helps traders study liquidity interaction rather than relying on isolated price levels.
Use the signals as a contextual tool alongside price action, market structure, and other technical analysis. Liquidity levels are derived from historical price structure and do not represent confirmed institutional orders or guaranteed future price behavior.

免责声明
这些信息和出版物并非旨在提供,也不构成TradingView提供或认可的任何形式的财务、投资、交易或其他类型的建议或推荐。请阅读使用条款了解更多信息。
免责声明
这些信息和出版物并非旨在提供,也不构成TradingView提供或认可的任何形式的财务、投资、交易或其他类型的建议或推荐。请阅读使用条款了解更多信息。