OPEN-SOURCE SCRIPT
Vector Candle 50% Real Body Levels
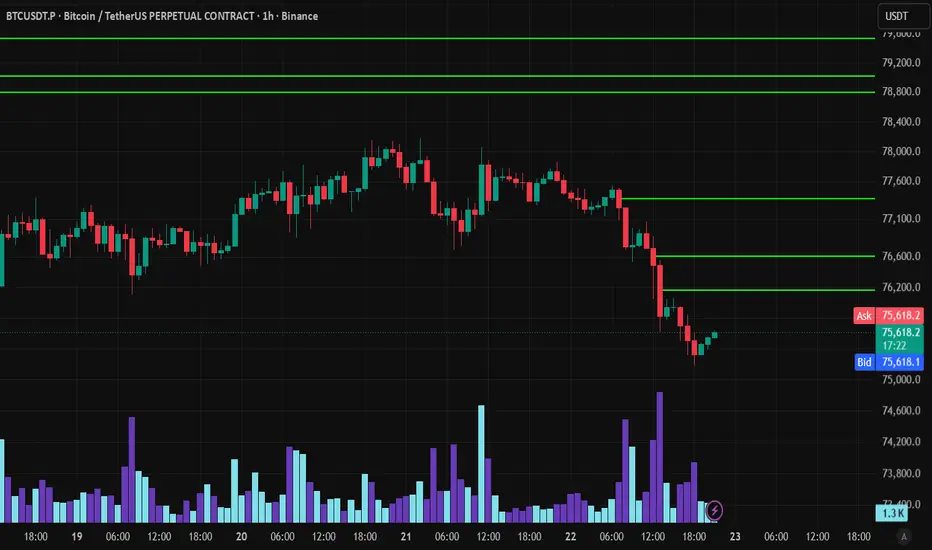
Vector Candle 50% Real Body Levels [v6]
Overview
This indicator identifies institutional volume anomalies (known as Vector Candles) and automatically plots a dynamic horizontal level at the exact 50% of their Real Body (the midpoint between open and close, completely ignoring the wicks).
In modern trading frameworks like Smart Money Concepts (SMC) or Order Blocks, the 50% threshold of a high-volume candle represents a premium point of control where heavy institutional orders were matched. This script visualizes these areas as high-probability support or resistance zones.
To keep your charts clean and noise-free, the script features a dynamic mitigation system: the moment any future candle touch or cross the line (even just with a wick), the level is considered "claimed" and immediately vanishes from your screen.
Key Features
Real Body Midpoint Calculation: Unlike standard tools that calculate the 50% level using the absolute High and Low, this indicator targets the core of the market commitment by averaging only the open and close prices.
Volume Threshold Filters: Dynamically benchmarks current volume against a Simple Moving Average (SMA) lookback period, filtering out normal market noise and highlighting only genuine capital injections.
Auto-Clean Mitigation Logic: Levels instantly self-destruct once price mitigates or tests the exact coordinate, ensuring every single line visible on your chart is 100% active and pending.
Engineered for v6 Performance: Built using Pine Script v6 User-Defined Types (UDTs) and efficient array memory management to prevent any charting lag, even during high-volatility sessions or lower timeframes.
Inputs & Customization
Average Volume Lookback: The period used to establish the baseline volume average (Default: 10).
Volume Multiplier 1 (VF) / Multiplier 2 (VA): Sensitivity thresholds to define what qualifies as an extraordinary volume vector (e.g., 2.0x or 1.5x above average).
Level Style Options: Easily adjust the horizontal line color and thickness to blend seamlessly with your personal chart layout.
How to Trade with It
Bullish Vector Mitigation (Support): When a high-volume bullish candle forms, look for the price to retrace downward to test the green horizontal line. This 50% body zone often acts as a strong bullish pivot.
Bearish Vector Mitigation (Resistance): When a high-volume bearish candle drops, look for short-term relief rallies to cap out exactly at the 50% body line, offering high R:R (Risk-to-Reward) short entries.
Breakout Tracking: If a level is pierced through aggressively rather than holding as pivot support/resistance, it indicates a structural shift in market direction.
Overview
This indicator identifies institutional volume anomalies (known as Vector Candles) and automatically plots a dynamic horizontal level at the exact 50% of their Real Body (the midpoint between open and close, completely ignoring the wicks).
In modern trading frameworks like Smart Money Concepts (SMC) or Order Blocks, the 50% threshold of a high-volume candle represents a premium point of control where heavy institutional orders were matched. This script visualizes these areas as high-probability support or resistance zones.
To keep your charts clean and noise-free, the script features a dynamic mitigation system: the moment any future candle touch or cross the line (even just with a wick), the level is considered "claimed" and immediately vanishes from your screen.
Key Features
Real Body Midpoint Calculation: Unlike standard tools that calculate the 50% level using the absolute High and Low, this indicator targets the core of the market commitment by averaging only the open and close prices.
Volume Threshold Filters: Dynamically benchmarks current volume against a Simple Moving Average (SMA) lookback period, filtering out normal market noise and highlighting only genuine capital injections.
Auto-Clean Mitigation Logic: Levels instantly self-destruct once price mitigates or tests the exact coordinate, ensuring every single line visible on your chart is 100% active and pending.
Engineered for v6 Performance: Built using Pine Script v6 User-Defined Types (UDTs) and efficient array memory management to prevent any charting lag, even during high-volatility sessions or lower timeframes.
Inputs & Customization
Average Volume Lookback: The period used to establish the baseline volume average (Default: 10).
Volume Multiplier 1 (VF) / Multiplier 2 (VA): Sensitivity thresholds to define what qualifies as an extraordinary volume vector (e.g., 2.0x or 1.5x above average).
Level Style Options: Easily adjust the horizontal line color and thickness to blend seamlessly with your personal chart layout.
How to Trade with It
Bullish Vector Mitigation (Support): When a high-volume bullish candle forms, look for the price to retrace downward to test the green horizontal line. This 50% body zone often acts as a strong bullish pivot.
Bearish Vector Mitigation (Resistance): When a high-volume bearish candle drops, look for short-term relief rallies to cap out exactly at the 50% body line, offering high R:R (Risk-to-Reward) short entries.
Breakout Tracking: If a level is pierced through aggressively rather than holding as pivot support/resistance, it indicates a structural shift in market direction.
开源脚本
秉承TradingView的精神,该脚本的作者将其开源,以便交易者可以查看和验证其功能。向作者致敬!您可以免费使用该脚本,但请记住,重新发布代码须遵守我们的网站规则。

免责声明
这些信息和出版物并非旨在提供,也不构成TradingView提供或认可的任何形式的财务、投资、交易或其他类型的建议或推荐。请阅读使用条款了解更多信息。
免责声明
这些信息和出版物并非旨在提供,也不构成TradingView提供或认可的任何形式的财务、投资、交易或其他类型的建议或推荐。请阅读使用条款了解更多信息。