HTF Fractals
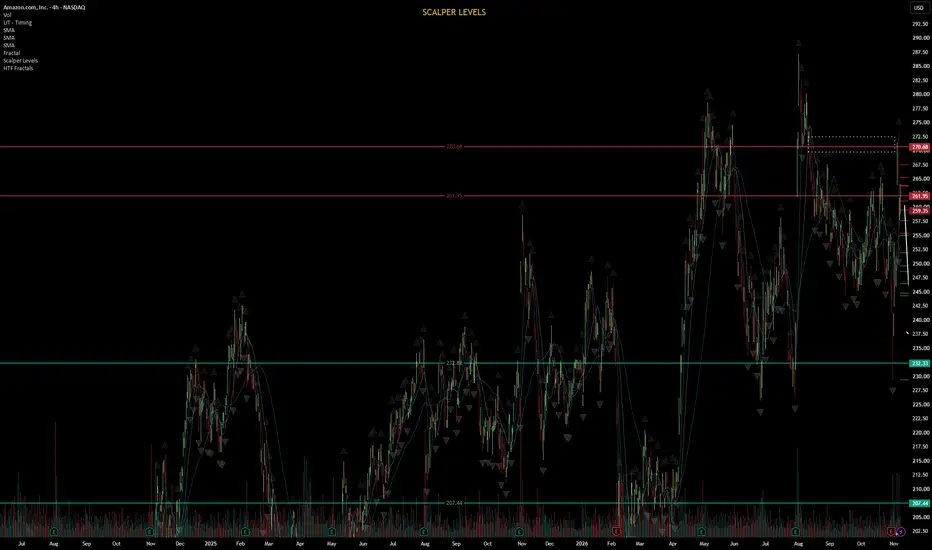
HTF Fractals
Displays Higher Timeframe (HTF) Williams Fractals directly on your lower timeframe chart as clean horizontal lines.
Features:
Plots confirmed fractal highs and lows from any higher timeframe (Daily, 4H, 1H, etc.)
Adjustable fractal strength — control how many bars are required on each side (classic Williams = 2)
Limits the number of levels shown to keep the chart clean
Fully customizable colors, line width, and whether lines extend to the right
Non-repainting on historical data
How to use:
Set your desired Higher Timeframe in the settings
Adjust “Bars each side” to control fractal sensitivity
The most recent HTF fractal highs (red) and lows (green) will appear as horizontal levels on your chart
Useful for identifying higher timeframe support/resistance and key swing points while trading on lower timeframes.
Displays Higher Timeframe (HTF) Williams Fractals directly on your lower timeframe chart as clean horizontal lines.
Features:
Plots confirmed fractal highs and lows from any higher timeframe (Daily, 4H, 1H, etc.)
Adjustable fractal strength — control how many bars are required on each side (classic Williams = 2)
Limits the number of levels shown to keep the chart clean
Fully customizable colors, line width, and whether lines extend to the right
Non-repainting on historical data
How to use:
Set your desired Higher Timeframe in the settings
Adjust “Bars each side” to control fractal sensitivity
The most recent HTF fractal highs (red) and lows (green) will appear as horizontal levels on your chart
Useful for identifying higher timeframe support/resistance and key swing points while trading on lower timeframes.

免责声明
这些信息和出版物并非旨在提供,也不构成TradingView提供或认可的任何形式的财务、投资、交易或其他类型的建议或推荐。请阅读使用条款了解更多信息。
免责声明
这些信息和出版物并非旨在提供,也不构成TradingView提供或认可的任何形式的财务、投资、交易或其他类型的建议或推荐。请阅读使用条款了解更多信息。