OPEN-SOURCE SCRIPT
Multi-Timeframe MA Cross
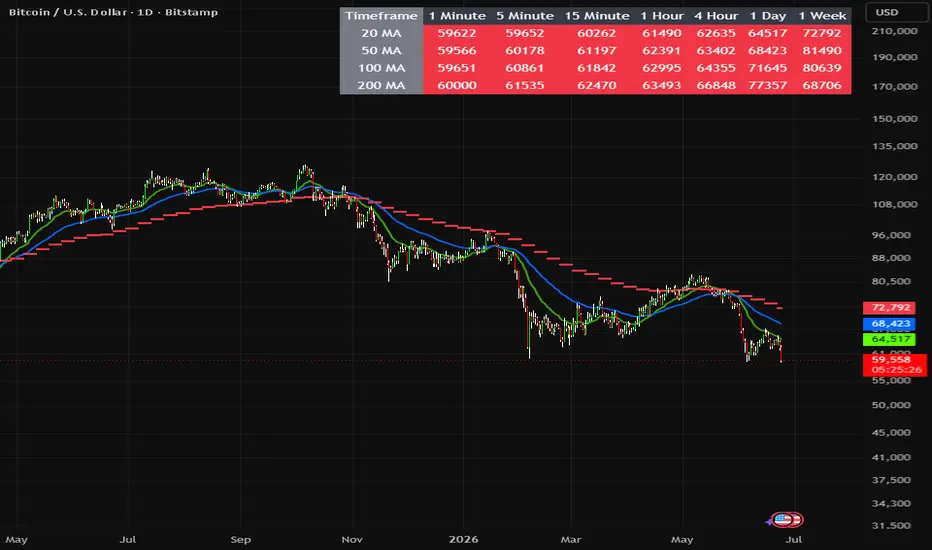
Multi-Timeframe MA Cross (MTFMAC) is a professional-grade trend analysis tool designed for traders who wish to view market structure across multiple timeframes at a glance. It consolidates key exponential moving averages (EMAs) into a single dashboard, helping traders make quick, informed decisions based on price alignment with moving averages.
This indicator provides a clear visual overview of trend direction and alignment from intraday (1-minute) to weekly charts. By highlighting whether price is above or below key EMAs and signalling EMA crossovers, traders can quickly identify bullish or bearish trends, trend strength, and high-probability trade setups.
Key Features
Multi-timeframe EMA dashboard (1 min → 1 week)
Real-time trend alignment for 20, 50, 100, and 200 EMAs
Visual "Above/Below" signals for each EMA
Weekly EMA overlays for higher timeframe context
Alerts for bullish/bearish alignment and EMA crosses
Fully customisable EMA lengths and visual settings
Professional table and chart display, overlaying price
How It Works
Compares the current price to 20, 50, 100, and 200 EMAs across multiple timeframes.
Colours indicate whether price is above (green) or below (red) the EMA.
Weekly EMA lines are plotted as dashed or circle-style overlays for macro trend context.
Alerts notify the trader when:
All EMAs align bullishly or bearishly
20 EMA crosses above or below 50 EMA
Best Use Cases
Trend-following strategies
Multi-timeframe confirmation
Swing and intraday trading
Spotting market bias and trend reversals
High-probability trade filtering
Alerts
Bullish Trend Alignment: All EMAs in ascending order, price above EMAs
Bearish Trend Alignment: All EMAs in descending order, price below EMAs
Bullish EMA Cross: 20 EMA crosses above 50 EMA
Bearish EMA Cross: 20 EMA crosses below 50 EMA
Notes and Disclaimers
This indicator does not repaint; all signals are based on confirmed bar data.
Use as a decision-support tool, not as sole trade advice. Combine with risk management.
Optimised for clear visualisation and multi-timeframe analysis.
This indicator provides a clear visual overview of trend direction and alignment from intraday (1-minute) to weekly charts. By highlighting whether price is above or below key EMAs and signalling EMA crossovers, traders can quickly identify bullish or bearish trends, trend strength, and high-probability trade setups.
Key Features
Multi-timeframe EMA dashboard (1 min → 1 week)
Real-time trend alignment for 20, 50, 100, and 200 EMAs
Visual "Above/Below" signals for each EMA
Weekly EMA overlays for higher timeframe context
Alerts for bullish/bearish alignment and EMA crosses
Fully customisable EMA lengths and visual settings
Professional table and chart display, overlaying price
How It Works
Compares the current price to 20, 50, 100, and 200 EMAs across multiple timeframes.
Colours indicate whether price is above (green) or below (red) the EMA.
Weekly EMA lines are plotted as dashed or circle-style overlays for macro trend context.
Alerts notify the trader when:
All EMAs align bullishly or bearishly
20 EMA crosses above or below 50 EMA
Best Use Cases
Trend-following strategies
Multi-timeframe confirmation
Swing and intraday trading
Spotting market bias and trend reversals
High-probability trade filtering
Alerts
Bullish Trend Alignment: All EMAs in ascending order, price above EMAs
Bearish Trend Alignment: All EMAs in descending order, price below EMAs
Bullish EMA Cross: 20 EMA crosses above 50 EMA
Bearish EMA Cross: 20 EMA crosses below 50 EMA
Notes and Disclaimers
This indicator does not repaint; all signals are based on confirmed bar data.
Use as a decision-support tool, not as sole trade advice. Combine with risk management.
Optimised for clear visualisation and multi-timeframe analysis.
开源脚本
秉承TradingView的精神,该脚本的作者将其开源,以便交易者可以查看和验证其功能。向作者致敬!您可以免费使用该脚本,但请记住,重新发布代码须遵守我们的网站规则。

免责声明
这些信息和出版物并非旨在提供,也不构成TradingView提供或认可的任何形式的财务、投资、交易或其他类型的建议或推荐。请阅读使用条款了解更多信息。
开源脚本
秉承TradingView的精神,该脚本的作者将其开源,以便交易者可以查看和验证其功能。向作者致敬!您可以免费使用该脚本,但请记住,重新发布代码须遵守我们的网站规则。
免责声明
这些信息和出版物并非旨在提供,也不构成TradingView提供或认可的任何形式的财务、投资、交易或其他类型的建议或推荐。请阅读使用条款了解更多信息。