Session Auction Profile Map [Jayadev Rana]
WHAT IT IS
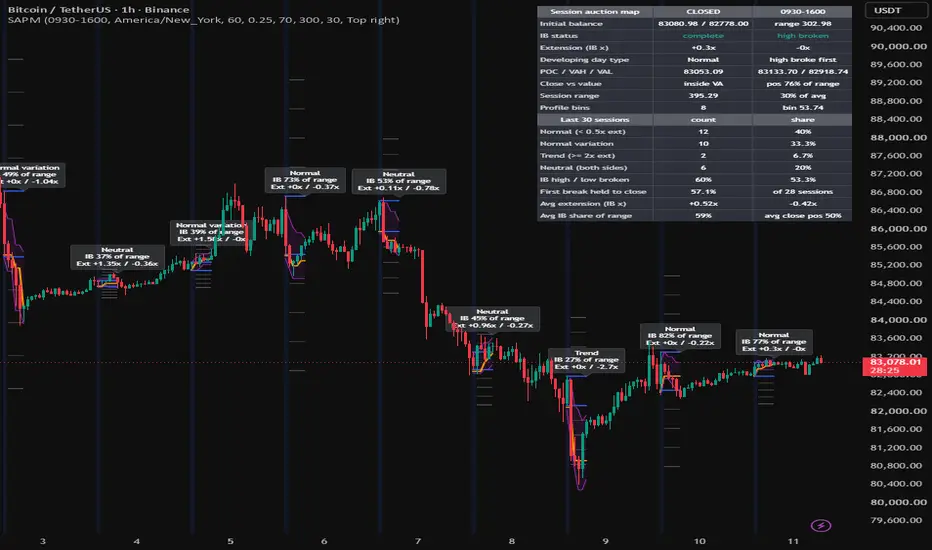
Session Auction Profile Map is an information tool built around Auction Market Theory. For every session it tracks the initial balance, builds a developing volume profile with POC, VAH and VAL, draws an extension ladder measured in initial-balance multiples, classifies the finished session into a day type, and keeps rolling statistics over the last N sessions so the current session can be read against its own history. It does not produce entry or exit signals.
HOW IT WORKS
1. Session and initial balance. The session window and time zone are inputs. The initial balance (IB) is the high-low range of the first X minutes of the session (default 60). While the IB forms the background is shaded; once it is complete the IB high and low are plotted for the rest of the session.
2. Extension ladder. From the completed IB the script plots levels at +0.5x, +1x, +1.5x and +2x of the IB range above the IB high and the mirror levels below the IB low. These are the reference distances used in day-type classification.
3. Developing volume profile. Each session the price axis is cut into bins whose height is ATR(14) at the session open multiplied by the bin-size input. Every bar spreads its volume evenly over the bins it touched. From that histogram the script computes the point of control (bin with the most volume) and the value area (the contiguous set of bins around the POC holding the value-area percentage, default 70). POC, VAH and VAL are plotted as developing lines and the value area is filled. On symbols without volume the profile falls back to a time profile.
4. Day type. When the session closes the maximum extension beyond the IB on each side is measured in IB multiples and the session is classified: Normal (less than 0.5x on both sides), Normal variation (0.5x to 2x on one side), Trend (2x or more on one side), Neutral (both sides broken). A label at the session close shows the type, the IB share of the day range and both extensions.
5. Rolling statistics. The last N sessions (input) are stored and summarised: share of each day type, how often the IB high and IB low were broken, how often the first side broken was still the side the session closed on, average extension up and down in IB multiples, the average IB share of the day range and the average close position inside the day range.
THE TABLE
Live block: minutes into the session, IB high/low/range, IB status (forming, complete, which side broken), extension so far, the developing day type, which side broke first, POC/VAH/VAL, close versus value area, session range as a percentage of the average session range, and the number of profile bins in use.
History block: the statistics listed in point 5.
INPUTS
Session: window, time zone, initial balance minutes.
Volume profile: bin size as an ATR multiple, value area percentage, maximum bins per session (safety cap).
Statistics: number of sessions kept.
Display: toggles for IB levels, extension ladder, POC/VAH/VAL, IB shading, day-type label and table, table position, colours.
ALERTS
Initial balance high broken, initial balance low broken, close crossed the developing POC, session closed. These are informational events, not trade signals.
INTENDED USE
Intraday charts (1 to 30 minute) on instruments with a defined session: index futures, stocks, commodities. For 24-hour markets set the session to 0000-0000 to profile each calendar day. Timeframes larger than the initial balance length make the IB meaningless.
LIMITATIONS
The profile is built from chart bars, not from tick data, so volume inside a bar is assumed to be spread evenly across its range. Developing POC, VAH and VAL move while the session is open and are only final at the close. The day-type label is placed at the session close and never changes afterwards. Statistics need at least a few sessions of history before they are meaningful. Sessions that start before the loaded history begins are ignored.
This script is an analysis tool for study and discretionary use. It is not financial advice and past session behaviour does not predict future sessions.
Session Auction Profile Map is an information tool built around Auction Market Theory. For every session it tracks the initial balance, builds a developing volume profile with POC, VAH and VAL, draws an extension ladder measured in initial-balance multiples, classifies the finished session into a day type, and keeps rolling statistics over the last N sessions so the current session can be read against its own history. It does not produce entry or exit signals.
HOW IT WORKS
1. Session and initial balance. The session window and time zone are inputs. The initial balance (IB) is the high-low range of the first X minutes of the session (default 60). While the IB forms the background is shaded; once it is complete the IB high and low are plotted for the rest of the session.
2. Extension ladder. From the completed IB the script plots levels at +0.5x, +1x, +1.5x and +2x of the IB range above the IB high and the mirror levels below the IB low. These are the reference distances used in day-type classification.
3. Developing volume profile. Each session the price axis is cut into bins whose height is ATR(14) at the session open multiplied by the bin-size input. Every bar spreads its volume evenly over the bins it touched. From that histogram the script computes the point of control (bin with the most volume) and the value area (the contiguous set of bins around the POC holding the value-area percentage, default 70). POC, VAH and VAL are plotted as developing lines and the value area is filled. On symbols without volume the profile falls back to a time profile.
4. Day type. When the session closes the maximum extension beyond the IB on each side is measured in IB multiples and the session is classified: Normal (less than 0.5x on both sides), Normal variation (0.5x to 2x on one side), Trend (2x or more on one side), Neutral (both sides broken). A label at the session close shows the type, the IB share of the day range and both extensions.
5. Rolling statistics. The last N sessions (input) are stored and summarised: share of each day type, how often the IB high and IB low were broken, how often the first side broken was still the side the session closed on, average extension up and down in IB multiples, the average IB share of the day range and the average close position inside the day range.
THE TABLE
Live block: minutes into the session, IB high/low/range, IB status (forming, complete, which side broken), extension so far, the developing day type, which side broke first, POC/VAH/VAL, close versus value area, session range as a percentage of the average session range, and the number of profile bins in use.
History block: the statistics listed in point 5.
INPUTS
Session: window, time zone, initial balance minutes.
Volume profile: bin size as an ATR multiple, value area percentage, maximum bins per session (safety cap).
Statistics: number of sessions kept.
Display: toggles for IB levels, extension ladder, POC/VAH/VAL, IB shading, day-type label and table, table position, colours.
ALERTS
Initial balance high broken, initial balance low broken, close crossed the developing POC, session closed. These are informational events, not trade signals.
INTENDED USE
Intraday charts (1 to 30 minute) on instruments with a defined session: index futures, stocks, commodities. For 24-hour markets set the session to 0000-0000 to profile each calendar day. Timeframes larger than the initial balance length make the IB meaningless.
LIMITATIONS
The profile is built from chart bars, not from tick data, so volume inside a bar is assumed to be spread evenly across its range. Developing POC, VAH and VAL move while the session is open and are only final at the close. The day-type label is placed at the session close and never changes afterwards. Statistics need at least a few sessions of history before they are meaningful. Sessions that start before the loaded history begins are ignored.
This script is an analysis tool for study and discretionary use. It is not financial advice and past session behaviour does not predict future sessions.

免责声明
这些信息和出版物并非旨在提供,也不构成TradingView提供或认可的任何形式的财务、投资、交易或其他类型的建议或推荐。请阅读使用条款了解更多信息。
免责声明
这些信息和出版物并非旨在提供,也不构成TradingView提供或认可的任何形式的财务、投资、交易或其他类型的建议或推荐。请阅读使用条款了解更多信息。