OPEN-SOURCE SCRIPT
Quantum Scanner Equalizer [Point algo]
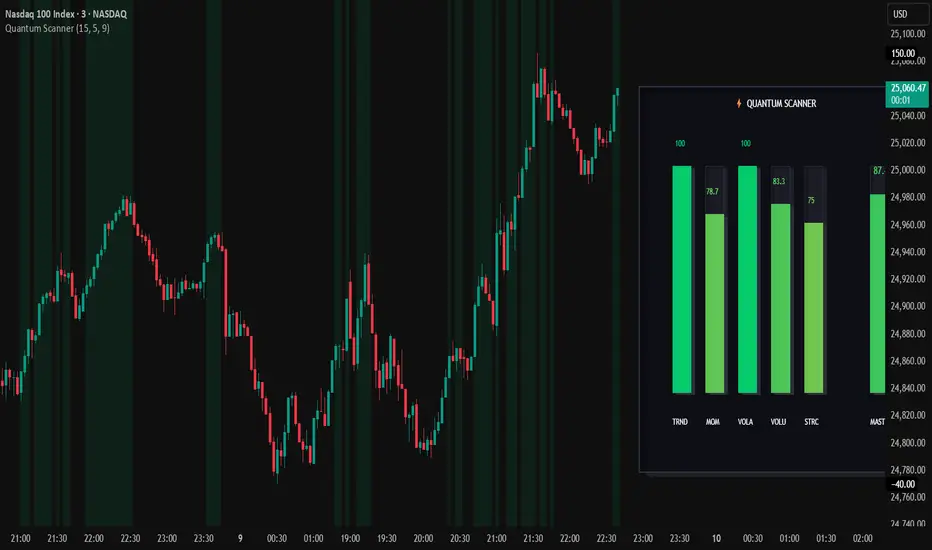
The Quantum State Scanner [Pro Equalizer] is an advanced quantitative dashboard designed to provide a comprehensive "Health Check" of any financial instrument. Instead of relying on a single timeframe or a single mathematical model, the Quantum Scanner aggregates data across 12 distinct lookback periods (based on the Fibonacci sequence) to calculate the market's true state.
By normalizing complex data into a simplified 0-100 Equalizer HUD, traders can instantly identify whether a move is backed by broad-spectrum consensus or is simply a low-conviction anomaly.
The 5 Pillars of Quantum Analysis
The scanner calculates five core "Quantum Pillars" before aggregating them into a final Master Score:
1. Trend (TRND): Analyzes the relationship between Price, VWMA, and EMA across 12 periods. Considers whether price is structurally bullish or bearish.
2. Momentum (MOM): Uses a Stoch-RSI derivation to measure the speed of price movement and identify overbought/oversold exhaustion zones.
3. Volatility (VOLA): Employs a Bollinger/Keltner Squeeze engine. Higher scores indicate expanding volatility (expansion), while lower scores indicate a squeeze (contraction).
4. Volume Delta (VOLU): Measures the internal force of the market by calculating Buy vs. Sell volume pressure.
5. Structure (STRC): A price-action engine that scans for liquidity sweeps (High/Low breaks) and candle rejections to determine structural strength.
How to Read the Scanner
Key Features
1. Dynamic HUD: A sleek, minimalist "Equalizer" UI positioned to the right of your price action.
2. Aggregated Logic: Processes data from lookback periods 5 through 987 simultaneously.
3. Right-Offset Control: Easily move the dashboard to prevent it from overlapping with your candles.
Disclaimer:
Educational Purpose Only: This indicator ("The Script") is provided for educational and informational purposes only. It does not constitute financial, investment, tax, or legal advice.
No Guarantee of Results: Past performance, whether actual or simulated by backtesting, is not indicative of future results. The mathematical models used (including GARCH, Ito’s Lemma, and Volume-Weighted calculations) are theoretical and do not account for market slippage, liquidity gaps, or "black swan" events.
Assumption of Risk: Trading involves a substantial risk of loss and is not suitable for every investor. You are solely responsible for your own trading decisions. Pointalgo and its creators shall not be held liable for any financial losses or damages resulting from the use of this script.
By normalizing complex data into a simplified 0-100 Equalizer HUD, traders can instantly identify whether a move is backed by broad-spectrum consensus or is simply a low-conviction anomaly.
The 5 Pillars of Quantum Analysis
The scanner calculates five core "Quantum Pillars" before aggregating them into a final Master Score:
1. Trend (TRND): Analyzes the relationship between Price, VWMA, and EMA across 12 periods. Considers whether price is structurally bullish or bearish.
2. Momentum (MOM): Uses a Stoch-RSI derivation to measure the speed of price movement and identify overbought/oversold exhaustion zones.
3. Volatility (VOLA): Employs a Bollinger/Keltner Squeeze engine. Higher scores indicate expanding volatility (expansion), while lower scores indicate a squeeze (contraction).
4. Volume Delta (VOLU): Measures the internal force of the market by calculating Buy vs. Sell volume pressure.
5. Structure (STRC): A price-action engine that scans for liquidity sweeps (High/Low breaks) and candle rejections to determine structural strength.
How to Read the Scanner
- 0-40 (Red Zone): Strong Bearish Consensus.
- 40-60 (Yellow Zone): Neutral / Indecision / Consolidation.
- 60-100 (Green Zone): Strong Bullish Consensus.
- High Conviction Signals: When the Master Score exceeds 80 or drops below 20, the background of the chart will dynamically highlight, signaling a potential "Power Move" or trend ignition.
Key Features
1. Dynamic HUD: A sleek, minimalist "Equalizer" UI positioned to the right of your price action.
2. Aggregated Logic: Processes data from lookback periods 5 through 987 simultaneously.
3. Right-Offset Control: Easily move the dashboard to prevent it from overlapping with your candles.
Disclaimer:
Educational Purpose Only: This indicator ("The Script") is provided for educational and informational purposes only. It does not constitute financial, investment, tax, or legal advice.
No Guarantee of Results: Past performance, whether actual or simulated by backtesting, is not indicative of future results. The mathematical models used (including GARCH, Ito’s Lemma, and Volume-Weighted calculations) are theoretical and do not account for market slippage, liquidity gaps, or "black swan" events.
Assumption of Risk: Trading involves a substantial risk of loss and is not suitable for every investor. You are solely responsible for your own trading decisions. Pointalgo and its creators shall not be held liable for any financial losses or damages resulting from the use of this script.
开源脚本
秉承TradingView的精神,该脚本的作者将其开源,以便交易者可以查看和验证其功能。向作者致敬!您可以免费使用该脚本,但请记住,重新发布代码须遵守我们的网站规则。

Unlock powerful tools & indicators → pointalgo.com
免责声明
这些信息和出版物并非旨在提供,也不构成TradingView提供或认可的任何形式的财务、投资、交易或其他类型的建议或推荐。请阅读使用条款了解更多信息。
开源脚本
秉承TradingView的精神,该脚本的作者将其开源,以便交易者可以查看和验证其功能。向作者致敬!您可以免费使用该脚本,但请记住,重新发布代码须遵守我们的网站规则。
Unlock powerful tools & indicators → pointalgo.com
免责声明
这些信息和出版物并非旨在提供,也不构成TradingView提供或认可的任何形式的财务、投资、交易或其他类型的建议或推荐。请阅读使用条款了解更多信息。