OPEN-SOURCE SCRIPT
Aurora SPI Sessions
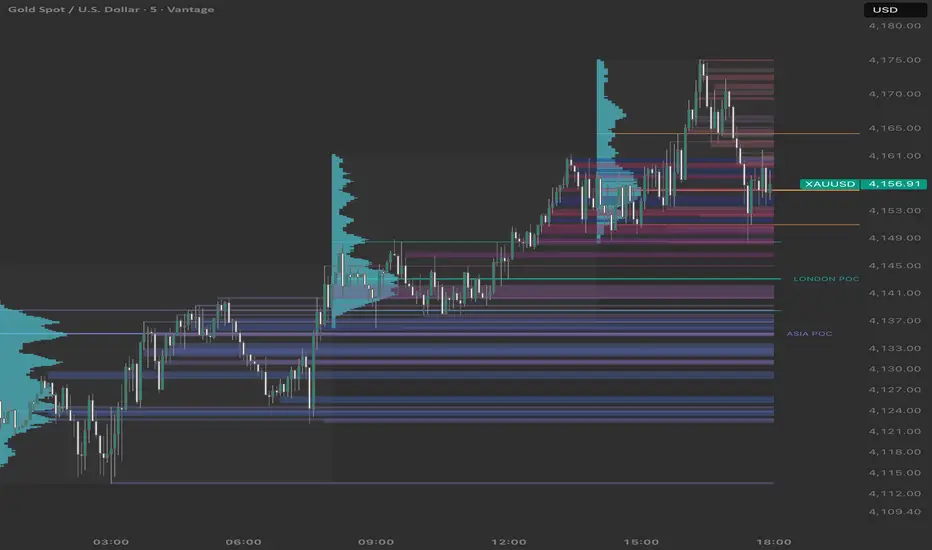
Aurora Session Profiles
█ Overview
Aurora Session Profiles maps volume separately for the Asia/Tokyo, London/Europe, and US/New York sessions. It works as a standalone indicator or as an overlay with Aurora SPI, adding session-specific volume context to SPI’s structure and zones.
Each session builds its own price-row profile and can display POC, VAH, and VAL. The indicator also identifies Low Volume Nodes (LVNs) and High Volume Nodes (HVNs) and extends their zones through the current Tokyo cycle.
█ How It Works
⚪ Session Profiles
Candle volume is distributed across the price rows crossed by each sampled candle. Complete lower-timeframe samples are used when available; otherwise, the indicator uses chart candles. Profiles use 200 rows by default, with up to 250 configurable rows.
Pine Script®
⚪ LVN and HVN Zones
The indicator searches each profile for volume valleys and peaks on both sides of price. LVNs represent relatively thin volume corridors; HVNs represent concentrated activity. Box boundaries follow the calculated corridor. Nearby gaps are not filled simply to create a larger zone.
A confirmed zone can remain visible after its session ends. When the developing profile confirms the same node again, its boundaries update to the newly calculated corridor. Older, distant zones that are no longer confirmed are cleared gradually. The next Tokyo session starts a new cycle.
⚪ Volume Strength and Row Lines
Volume strength is measured against the strongest row in that session’s profile. A thinner LVN valley or fuller HVN peak produces a stronger color tint. Optional lines mark the lowest- and highest-volume row within each calculated zone.
Pine Script®
⚪ Age and Price Heat
New zones are more transparent. As they age, they become more visible; volume affects their color tint, not their age-based transparency.
Zones above the recent price range shift toward a configurable warm color as their distance increases. Zones below that range shift toward a configurable cool color. The distance is scaled by ATR so the heat responds to the chart’s volatility.
█ How to Use
⚪ Standalone
Compare the three session profiles to see where volume was concentrated or thin. Use POC and value-area levels as session references, then inspect the LVN and HVN corridors in the context of price action.
⚪ Alongside Aurora SPI
Overlay Aurora Session Profiles with Aurora SPI to compare session-specific volume areas with SPI’s broader zones and structure. The session zones use borderless, transparent boxes so both indicators can remain readable on the same chart.
⚪ Heat Timing
• Scalp 1m: A shorter, more responsive age and price-range view.
• Swing 5–15m: A middle horizon.
• Slower: A broader age and price-range view.
• Custom: Manual timing controls.
These modes change the heat display. They do not change the underlying LVN/HVN detection rules.
█ Settings
• Market windows: Choose Berlin session windows or each market’s local clock, and enable sessions individually.
• Profile detail: Set the number of price rows and lower analysis timeframe.
• LVN/HVN detection: Adjust node count, smoothing, prominence, and corridor width.
• Heat and age: Set the recent price range, ATR distance, colors, and the increase in visibility as zones age.
• Volume-row lines: Show the lowest row, highest row, or both for LVNs and HVNs.
█ Data Notes
The profiles estimate price-level volume from candle ranges and the symbol’s available volume feed. They do not record individual trades at each price. Zones provide market context, not automatic entry or exit signals.
Aurora Session Profiles is derived from Aurora SPI by Drizzle_Algo56 and is licensed under Creative Commons Attribution-NonCommercial-ShareAlike 4.0 International.
█ Overview
Aurora Session Profiles maps volume separately for the Asia/Tokyo, London/Europe, and US/New York sessions. It works as a standalone indicator or as an overlay with Aurora SPI, adding session-specific volume context to SPI’s structure and zones.
Each session builds its own price-row profile and can display POC, VAH, and VAL. The indicator also identifies Low Volume Nodes (LVNs) and High Volume Nodes (HVNs) and extends their zones through the current Tokyo cycle.
█ How It Works
⚪ Session Profiles
Candle volume is distributed across the price rows crossed by each sampled candle. Complete lower-timeframe samples are used when available; otherwise, the indicator uses chart candles. Profiles use 200 rows by default, with up to 250 configurable rows.
⚪ LVN and HVN Zones
The indicator searches each profile for volume valleys and peaks on both sides of price. LVNs represent relatively thin volume corridors; HVNs represent concentrated activity. Box boundaries follow the calculated corridor. Nearby gaps are not filled simply to create a larger zone.
A confirmed zone can remain visible after its session ends. When the developing profile confirms the same node again, its boundaries update to the newly calculated corridor. Older, distant zones that are no longer confirmed are cleared gradually. The next Tokyo session starts a new cycle.
⚪ Volume Strength and Row Lines
Volume strength is measured against the strongest row in that session’s profile. A thinner LVN valley or fuller HVN peak produces a stronger color tint. Optional lines mark the lowest- and highest-volume row within each calculated zone.
⚪ Age and Price Heat
New zones are more transparent. As they age, they become more visible; volume affects their color tint, not their age-based transparency.
Zones above the recent price range shift toward a configurable warm color as their distance increases. Zones below that range shift toward a configurable cool color. The distance is scaled by ATR so the heat responds to the chart’s volatility.
█ How to Use
⚪ Standalone
Compare the three session profiles to see where volume was concentrated or thin. Use POC and value-area levels as session references, then inspect the LVN and HVN corridors in the context of price action.
⚪ Alongside Aurora SPI
Overlay Aurora Session Profiles with Aurora SPI to compare session-specific volume areas with SPI’s broader zones and structure. The session zones use borderless, transparent boxes so both indicators can remain readable on the same chart.
⚪ Heat Timing
• Scalp 1m: A shorter, more responsive age and price-range view.
• Swing 5–15m: A middle horizon.
• Slower: A broader age and price-range view.
• Custom: Manual timing controls.
These modes change the heat display. They do not change the underlying LVN/HVN detection rules.
█ Settings
• Market windows: Choose Berlin session windows or each market’s local clock, and enable sessions individually.
• Profile detail: Set the number of price rows and lower analysis timeframe.
• LVN/HVN detection: Adjust node count, smoothing, prominence, and corridor width.
• Heat and age: Set the recent price range, ATR distance, colors, and the increase in visibility as zones age.
• Volume-row lines: Show the lowest row, highest row, or both for LVNs and HVNs.
█ Data Notes
The profiles estimate price-level volume from candle ranges and the symbol’s available volume feed. They do not record individual trades at each price. Zones provide market context, not automatic entry or exit signals.
Aurora Session Profiles is derived from Aurora SPI by Drizzle_Algo56 and is licensed under Creative Commons Attribution-NonCommercial-ShareAlike 4.0 International.
开源脚本
秉承TradingView的精神,该脚本的作者将其开源,以便交易者可以查看和验证其功能。向作者致敬!您可以免费使用该脚本,但请记住,重新发布代码须遵守我们的网站规则。

免责声明
这些信息和出版物并非旨在提供,也不构成TradingView提供或认可的任何形式的财务、投资、交易或其他类型的建议或推荐。请阅读使用条款了解更多信息。
开源脚本
秉承TradingView的精神,该脚本的作者将其开源,以便交易者可以查看和验证其功能。向作者致敬!您可以免费使用该脚本,但请记住,重新发布代码须遵守我们的网站规则。
免责声明
这些信息和出版物并非旨在提供,也不构成TradingView提供或认可的任何形式的财务、投资、交易或其他类型的建议或推荐。请阅读使用条款了解更多信息。