OPEN-SOURCE SCRIPT
已更新 RSI Dav1zoN
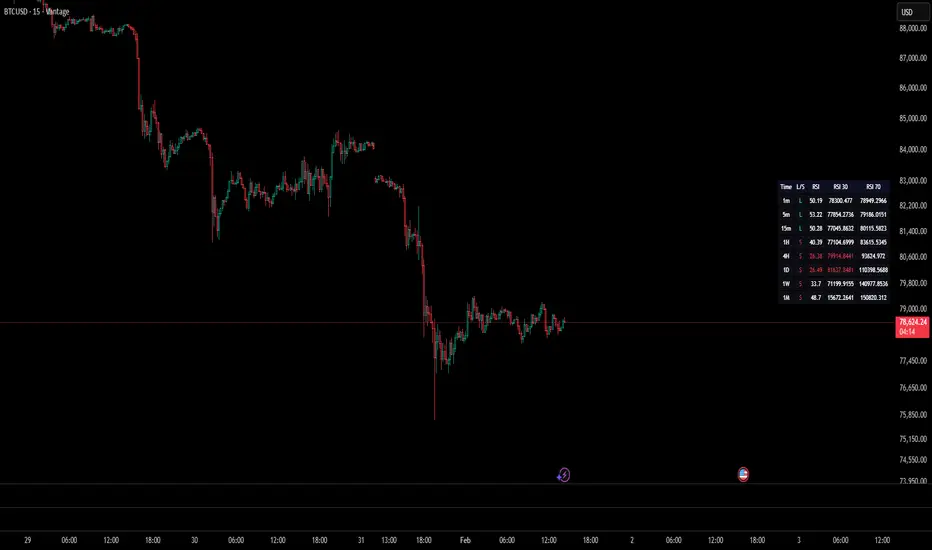
The RSI Grid is a multi-timeframe momentum dashboard designed to give a quick, structured view of market bias across several timeframes at once.
Instead of checking RSI on each timeframe manually, the grid shows direction, RSI value, and projected price levels in one place.
Instead of checking RSI on each timeframe manually, the grid shows direction, RSI value, and projected price levels in one place.
版本注释
The RSI Grid is a multi-timeframe momentum dashboard designed to give a quick, structured view of market bias across several timeframes at once.Instead of checking RSI on each timeframe manually, the grid shows direction, RSI value, and projected price levels in one place.
版本注释
The RSI Grid is a multi-timeframe momentum dashboard designed to give a quick, structured view of market bias across several timeframes at once.Instead of checking RSI on each timeframe manually, the grid shows direction, RSI value, and projected price levels in one place.
版本注释
The RSI Grid is a multi-timeframe momentum dashboard designed to give a quick, structured view of market bias across several timeframes at once.Instead of checking RSI on each timeframe manually, the grid shows direction, RSI value, and projected price levels in one place.
版本注释
COLOR UPDATE 版本注释
UPDATE WITH LONG SHORT AT TIMEFRAME 开源脚本
秉承TradingView的精神,该脚本的作者将其开源,以便交易者可以查看和验证其功能。向作者致敬!您可以免费使用该脚本,但请记住,重新发布代码须遵守我们的网站规则。

免责声明
这些信息和出版物并非旨在提供,也不构成TradingView提供或认可的任何形式的财务、投资、交易或其他类型的建议或推荐。请阅读使用条款了解更多信息。
免责声明
这些信息和出版物并非旨在提供,也不构成TradingView提供或认可的任何形式的财务、投资、交易或其他类型的建议或推荐。请阅读使用条款了解更多信息。