OPEN-SOURCE SCRIPT
Volume Profile Desk
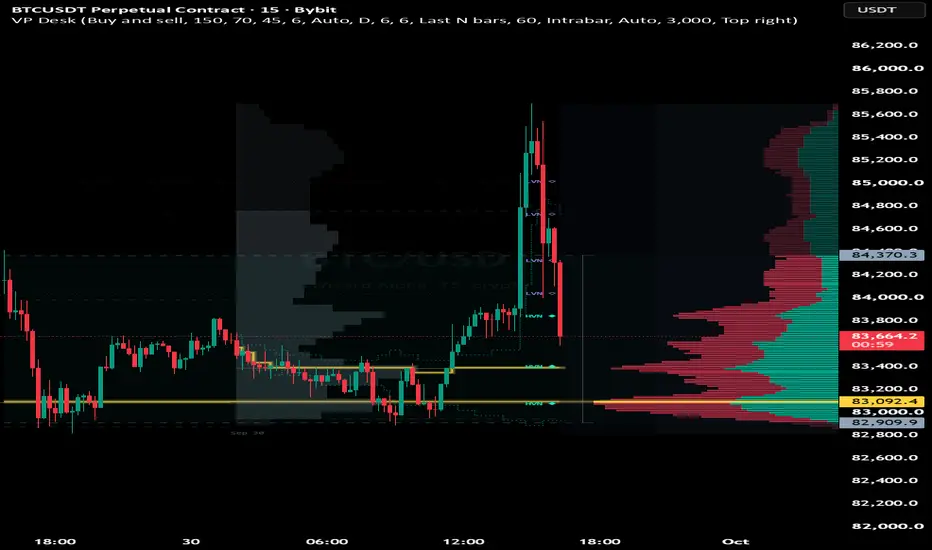
# 📊 volume profile desk
volume profile desk is an advanced market auction and volume analysis tool designed to show where trading activity is actually concentrated across price.
instead of looking only at candles, the indicator organizes volume by price and combines visible-range profiling, session structure, order-flow estimation, value areas, developing levels, naked poc tracking, high-volume and low-volume nodes, fixed-range analysis, and an integrated market desk.
the objective is to provide a structured view of **value, acceptance, rejection, participation and volume distribution** directly on the chart.
## 🔹 visible range volume profile
the main profile automatically analyzes the portion of the chart currently visible.
when the chart is moved or zoomed, the analyzed range changes with it.
three display modes are available:
**buy and sell** — separates estimated buying and selling participation inside each price row.
**volume** — displays the total volume distribution by price.
**delta** — highlights the difference between estimated buying and selling pressure.
the number of profile rows, profile width, offset and value-area percentage can all be adjusted.
## 🟡 poc — point of control
the poc represents the price row containing the highest concentration of volume inside the analyzed profile.
it can be used as a reference for the market's dominant area of activity.
price repeatedly interacting with the poc can indicate balance, while movement away from it can help identify a developing auction outside established value.
## 🔷 vah and val
the indicator calculates the value area around the poc.
**vah — value area high** represents the upper boundary of value.
**val — value area low** represents the lower boundary of value.
the default value area is 70%, but it can be adjusted from the settings.
price inside the value area represents trading within the established distribution. sustained trading outside vah or val can indicate that the market is attempting to establish value at a different level.
## ◆ hvn — high-volume nodes
high-volume nodes identify areas where significant volume accumulated.
these zones represent strong participation and established acceptance.
hvn areas can become important reference zones because the market previously spent substantial activity there.
## ◇ lvn — low-volume nodes
low-volume nodes identify thin sections of the profile where relatively little volume was exchanged.
these areas represent lower acceptance compared with surrounding prices.
because participation is thinner, price can sometimes travel rapidly through an lvn until it reaches another area of stronger volume concentration.
## 🧭 session profiles
the indicator can maintain individual profiles for previous market sessions.
session selection can operate automatically according to the chart timeframe or use a custom timeframe.
this makes it possible to compare how value develops from one session to another instead of analyzing every session as an isolated price move.
the number of historical session profiles displayed can also be controlled.
## ⚡ developing poc / vah / val
the current session is analyzed dynamically.
the developing poc, vah and val evolve as new volume enters the market.
this provides an important additional dimension: **value migration**.
a developing poc moving higher shows that the dominant volume concentration is shifting upward.
a developing poc moving lower shows that it is shifting downward.
a relatively stable developing poc suggests a more balanced auction.
## 🎯 naked poc
when a session finishes, its poc can remain untested.
the indicator tracks these historical naked pocs and extends them forward until price trades through them.
the closest untested levels can therefore remain visible as historical market references.
when price eventually reaches a naked poc, the indicator records the event.
## 📐 fixed range profile
a second independent profile can be created over a specific section of the market.
two anchoring methods are available:
**last n bars** — analyzes a configurable number of recent candles.
**time anchors** — analyzes the market between two selected timestamps.
this is useful for isolating a specific impulse, consolidation, breakout structure, trading session or other area without changing the main visible-range profile.
the fixed range calculates its own poc, vah, val, volume distribution, buy/sell participation and profile structure.
## ⚖️ order flow
the indicator estimates buying and selling participation using lower-timeframe intrabar information.
an automatic lower timeframe can be selected by the script, or the intrabar timeframe can be manually configured.
a candle-geometry method is also available as an alternative source.
the resulting information is used for buy/sell distribution, net delta and buy-share measurements.
## 📊 profile shapes
the desk automatically classifies the structure of the volume distribution.
**d profile** — relatively balanced distribution around a central poc.
**p profile** — volume concentrated toward the upper part of the distribution.
**b profile** — volume concentrated toward the lower part of the distribution.
**b / double distribution structure** — two important volume distributions separated by a low-volume area.
these structures provide additional context for understanding how the auction developed inside the analyzed range.
## 🖥️ desk panel
the integrated desk summarizes the important information without requiring every level to be interpreted manually.
depending on the enabled options, it can display:
• poc, vah and val
• value-area width
• current price location
• total analyzed volume
• net delta
• buy share
• profile shape
• auction context
• developing value migration
• nearest low-volume node
• closest untested poc
• key levels
• recent level events
## 🔔 level events
the script monitors interactions with important completed-session levels.
crosses of the previous session poc, vah and val are evaluated on confirmed bars.
naked poc fills are also detected and recorded.
these events can be used with tradingview alerts to monitor important changes without constantly watching the chart.
# 🎓 mini tutorial
### 1. start with the visible profile
load the indicator and keep the default **buy and sell** mode.
use approximately **70% value area** and enough rows to obtain useful detail without making the profile unnecessarily fragmented.
identify the three primary references:
**poc = highest-volume price**
**vah = upper boundary of value**
**val = lower boundary of value**
### 2. locate the current price
first determine whether price is:
**above vah** — the market is trading above established visible value.
**below val** — the market is trading below established visible value.
**inside value** — price remains within the main accepted distribution.
this gives immediate auction context before looking for a trade.
### 3. study value migration
compare the developing session poc with the previous session poc.
if developing value progressively moves higher, the market is building volume at higher prices.
if it moves lower, value is developing downward.
if both pocs remain close together, the auction is comparatively balanced.
### 4. mark hvn and lvn areas
use hvns as important accepted-volume references.
use lvns to identify thin areas separating larger distributions.
instead of treating every horizontal level equally, this helps distinguish heavily traded areas from zones where the market previously showed limited participation.
### 5. check order flow
compare **net delta** and **buy share** with the position of price.
strong buying participation while value migrates higher provides different information from strong buying activity occurring while price fails to establish higher value.
the same principle applies to selling pressure.
### 6. monitor naked pocs
keep the nearest naked pocs visible.
they represent previous session points of control that have not yet been revisited.
use them as contextual reference levels rather than automatic entry signals.
### 7. isolate important structures
activate **fixed range profile** when you want to analyze one specific market segment.
for example, anchor it to a consolidation before a breakout and compare its poc, value area and volume nodes with the current market structure.
### 8. combine the information
the strongest use of volume profile desk comes from confluence rather than from one isolated metric.
for example:
**price above vah + developing poc moving higher + positive buy participation**
shows a very different auction structure from:
**price above vah + poc remaining lower + weak or negative delta**
the first shows price and value developing in the same direction, while the second shows a potential disagreement between price location, value and participation.
## 🧠 practical workflow
**structure → value → location → migration → nodes → order flow → reaction**
start by identifying the profile structure.
locate poc, vah and val.
check where current price trades relative to value.
observe whether developing value is migrating.
identify nearby hvns, lvns and naked pocs.
then use delta and buy/sell participation to evaluate the activity occurring around those locations.
volume profile desk is designed to turn raw volume distribution into a structured auction map, allowing the trader to see not only where price moved, but **where the market actually conducted business while it moved**.
volume profile desk is an advanced market auction and volume analysis tool designed to show where trading activity is actually concentrated across price.
instead of looking only at candles, the indicator organizes volume by price and combines visible-range profiling, session structure, order-flow estimation, value areas, developing levels, naked poc tracking, high-volume and low-volume nodes, fixed-range analysis, and an integrated market desk.
the objective is to provide a structured view of **value, acceptance, rejection, participation and volume distribution** directly on the chart.
## 🔹 visible range volume profile
the main profile automatically analyzes the portion of the chart currently visible.
when the chart is moved or zoomed, the analyzed range changes with it.
three display modes are available:
**buy and sell** — separates estimated buying and selling participation inside each price row.
**volume** — displays the total volume distribution by price.
**delta** — highlights the difference between estimated buying and selling pressure.
the number of profile rows, profile width, offset and value-area percentage can all be adjusted.
## 🟡 poc — point of control
the poc represents the price row containing the highest concentration of volume inside the analyzed profile.
it can be used as a reference for the market's dominant area of activity.
price repeatedly interacting with the poc can indicate balance, while movement away from it can help identify a developing auction outside established value.
## 🔷 vah and val
the indicator calculates the value area around the poc.
**vah — value area high** represents the upper boundary of value.
**val — value area low** represents the lower boundary of value.
the default value area is 70%, but it can be adjusted from the settings.
price inside the value area represents trading within the established distribution. sustained trading outside vah or val can indicate that the market is attempting to establish value at a different level.
## ◆ hvn — high-volume nodes
high-volume nodes identify areas where significant volume accumulated.
these zones represent strong participation and established acceptance.
hvn areas can become important reference zones because the market previously spent substantial activity there.
## ◇ lvn — low-volume nodes
low-volume nodes identify thin sections of the profile where relatively little volume was exchanged.
these areas represent lower acceptance compared with surrounding prices.
because participation is thinner, price can sometimes travel rapidly through an lvn until it reaches another area of stronger volume concentration.
## 🧭 session profiles
the indicator can maintain individual profiles for previous market sessions.
session selection can operate automatically according to the chart timeframe or use a custom timeframe.
this makes it possible to compare how value develops from one session to another instead of analyzing every session as an isolated price move.
the number of historical session profiles displayed can also be controlled.
## ⚡ developing poc / vah / val
the current session is analyzed dynamically.
the developing poc, vah and val evolve as new volume enters the market.
this provides an important additional dimension: **value migration**.
a developing poc moving higher shows that the dominant volume concentration is shifting upward.
a developing poc moving lower shows that it is shifting downward.
a relatively stable developing poc suggests a more balanced auction.
## 🎯 naked poc
when a session finishes, its poc can remain untested.
the indicator tracks these historical naked pocs and extends them forward until price trades through them.
the closest untested levels can therefore remain visible as historical market references.
when price eventually reaches a naked poc, the indicator records the event.
## 📐 fixed range profile
a second independent profile can be created over a specific section of the market.
two anchoring methods are available:
**last n bars** — analyzes a configurable number of recent candles.
**time anchors** — analyzes the market between two selected timestamps.
this is useful for isolating a specific impulse, consolidation, breakout structure, trading session or other area without changing the main visible-range profile.
the fixed range calculates its own poc, vah, val, volume distribution, buy/sell participation and profile structure.
## ⚖️ order flow
the indicator estimates buying and selling participation using lower-timeframe intrabar information.
an automatic lower timeframe can be selected by the script, or the intrabar timeframe can be manually configured.
a candle-geometry method is also available as an alternative source.
the resulting information is used for buy/sell distribution, net delta and buy-share measurements.
## 📊 profile shapes
the desk automatically classifies the structure of the volume distribution.
**d profile** — relatively balanced distribution around a central poc.
**p profile** — volume concentrated toward the upper part of the distribution.
**b profile** — volume concentrated toward the lower part of the distribution.
**b / double distribution structure** — two important volume distributions separated by a low-volume area.
these structures provide additional context for understanding how the auction developed inside the analyzed range.
## 🖥️ desk panel
the integrated desk summarizes the important information without requiring every level to be interpreted manually.
depending on the enabled options, it can display:
• poc, vah and val
• value-area width
• current price location
• total analyzed volume
• net delta
• buy share
• profile shape
• auction context
• developing value migration
• nearest low-volume node
• closest untested poc
• key levels
• recent level events
## 🔔 level events
the script monitors interactions with important completed-session levels.
crosses of the previous session poc, vah and val are evaluated on confirmed bars.
naked poc fills are also detected and recorded.
these events can be used with tradingview alerts to monitor important changes without constantly watching the chart.
# 🎓 mini tutorial
### 1. start with the visible profile
load the indicator and keep the default **buy and sell** mode.
use approximately **70% value area** and enough rows to obtain useful detail without making the profile unnecessarily fragmented.
identify the three primary references:
**poc = highest-volume price**
**vah = upper boundary of value**
**val = lower boundary of value**
### 2. locate the current price
first determine whether price is:
**above vah** — the market is trading above established visible value.
**below val** — the market is trading below established visible value.
**inside value** — price remains within the main accepted distribution.
this gives immediate auction context before looking for a trade.
### 3. study value migration
compare the developing session poc with the previous session poc.
if developing value progressively moves higher, the market is building volume at higher prices.
if it moves lower, value is developing downward.
if both pocs remain close together, the auction is comparatively balanced.
### 4. mark hvn and lvn areas
use hvns as important accepted-volume references.
use lvns to identify thin areas separating larger distributions.
instead of treating every horizontal level equally, this helps distinguish heavily traded areas from zones where the market previously showed limited participation.
### 5. check order flow
compare **net delta** and **buy share** with the position of price.
strong buying participation while value migrates higher provides different information from strong buying activity occurring while price fails to establish higher value.
the same principle applies to selling pressure.
### 6. monitor naked pocs
keep the nearest naked pocs visible.
they represent previous session points of control that have not yet been revisited.
use them as contextual reference levels rather than automatic entry signals.
### 7. isolate important structures
activate **fixed range profile** when you want to analyze one specific market segment.
for example, anchor it to a consolidation before a breakout and compare its poc, value area and volume nodes with the current market structure.
### 8. combine the information
the strongest use of volume profile desk comes from confluence rather than from one isolated metric.
for example:
**price above vah + developing poc moving higher + positive buy participation**
shows a very different auction structure from:
**price above vah + poc remaining lower + weak or negative delta**
the first shows price and value developing in the same direction, while the second shows a potential disagreement between price location, value and participation.
## 🧠 practical workflow
**structure → value → location → migration → nodes → order flow → reaction**
start by identifying the profile structure.
locate poc, vah and val.
check where current price trades relative to value.
observe whether developing value is migrating.
identify nearby hvns, lvns and naked pocs.
then use delta and buy/sell participation to evaluate the activity occurring around those locations.
volume profile desk is designed to turn raw volume distribution into a structured auction map, allowing the trader to see not only where price moved, but **where the market actually conducted business while it moved**.
开源脚本
秉承TradingView的精神,该脚本的作者将其开源,以便交易者可以查看和验证其功能。向作者致敬!您可以免费使用该脚本,但请记住,重新发布代码须遵守我们的网站规则。

Light the candle that sleeps within you.
免责声明
这些信息和出版物并非旨在提供,也不构成TradingView提供或认可的任何形式的财务、投资、交易或其他类型的建议或推荐。请阅读使用条款了解更多信息。
开源脚本
秉承TradingView的精神,该脚本的作者将其开源,以便交易者可以查看和验证其功能。向作者致敬!您可以免费使用该脚本,但请记住,重新发布代码须遵守我们的网站规则。
Light the candle that sleeps within you.
免责声明
这些信息和出版物并非旨在提供,也不构成TradingView提供或认可的任何形式的财务、投资、交易或其他类型的建议或推荐。请阅读使用条款了解更多信息。