OPEN-SOURCE SCRIPT
RSI & MACD Suite
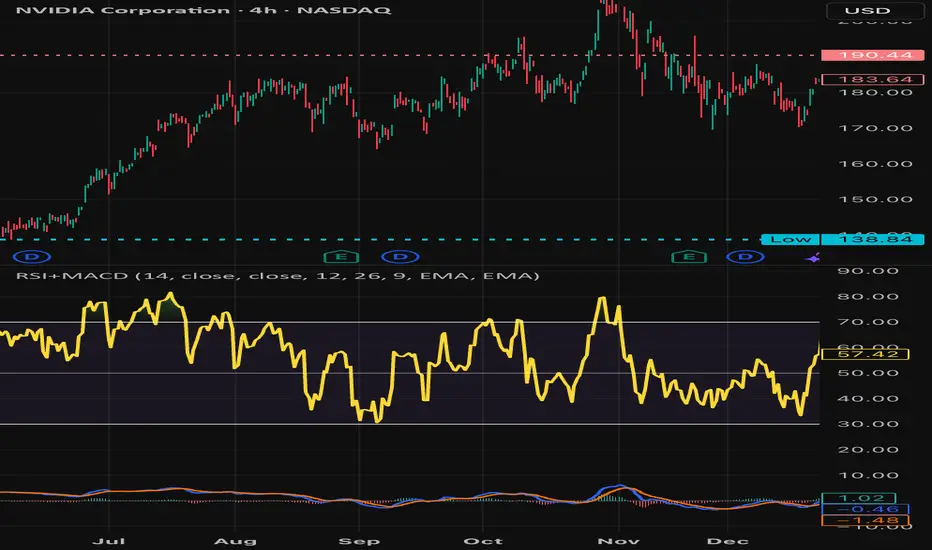
RSI & MACD Suite
A professional combination of two essential momentum indicators - Relative Strength Index (RSI) and Moving Average Convergence Divergence (MACD) - designed to provide comprehensive market analysis in a single, clean interface.
OVERVIEW
This indicator combines the power of RSI and MACD to help traders identify potential overbought/oversold conditions, momentum shifts, and trend changes. Both indicators are displayed with enhanced visual elements including gradient fills, customizable bands, and clear signal lines.
FEATURES
RSI (Relative Strength Index)
- Customizable Period: Adjustable RSI length (default: 14)
- Visual Zones: Overbought zone (above 70) with green gradient, Oversold zone (below 30) with red gradient, Background fill between bands for easy reference
- Key Levels: Clear horizontal lines at 30, 50, and 70
- Flexible Source: Choose any price source (close, open, high, low, etc.)
MACD (Moving Average Convergence Divergence)
- Customizable Parameters: Fast Length (default: 12), Slow Length (default: 26), Signal Length (default: 9)
- MA Type Selection: Choose between EMA or SMA for both oscillator and signal line
- Color-Coded Histogram: Green for bullish momentum, Red for bearish momentum
- Clear Signal Lines: Blue MACD line and orange Signal line for easy identification
ALERT CONDITIONS
The indicator includes 7 built-in alert conditions:
RSI Alerts:
1. RSI Overbought - Triggers when RSI crosses above 70
2. RSI Oversold - Triggers when RSI crosses below 30
3. RSI Midline Cross - Triggers when RSI crosses the 50 level
MACD Alerts:
4. MACD Bullish Cross - Triggers when MACD line crosses above Signal line
5. MACD Bearish Cross - Triggers when MACD line crosses below Signal line
6. MACD Histogram Bullish - Triggers when histogram crosses above zero
7. MACD Histogram Bearish - Triggers when histogram crosses below zero
CUSTOMIZATION
Clean Organization
- Inputs Tab: Separate groups for RSI and MACD settings
- Style Tab: All visual elements clearly labeled with "RSI -" or "MACD -" prefixes for easy identification
- Full Control: Customize colors, line widths, and visibility of all elements
Visual Clarity
- Professional color scheme optimized for both light and dark themes
- Gradient fills for intuitive zone identification
- Clear separation between RSI and MACD elements
SETTINGS
RSI Settings
- Length: Lookback period for RSI calculation (default: 14)
- Source: Price data to use for calculation (default: close)
MACD Settings
- Source: Price data to use for calculation (default: close)
- Fast Length: Period for fast moving average (default: 12)
- Slow Length: Period for slow moving average (default: 26)
- Signal Length: Period for signal line (default: 9)
- Oscillator MA Type: EMA or SMA for MACD calculation
- Signal MA Type: EMA or SMA for signal line
TECHNICAL DETAILS
- Pine Script Version: v6
- Indicator Type: Oscillator (subplot)
- Calculation Method: RSI uses Relative Strength Index with RMA smoothing, MACD uses Fast MA minus Slow MA with configurable MA types
- Input Validation: Built-in checks to ensure valid parameter combinations
NOTES
- Default settings are industry-standard values (RSI: 14, MACD: 12/26/9)
- All visual elements can be hidden/shown individually in the Style tab
- Alerts must be manually created by users through TradingView's alert system
- This indicator does not repaint - all signals are based on closed candles
WHO SHOULD USE THIS
- Day traders looking for momentum signals
- Swing traders identifying trend changes
- Technical analysts performing multi-indicator analysis
- Traders who want a clean, all-in-one momentum solution
DISCLAIMER
This indicator is for educational and informational purposes only. It does not constitute financial advice. Always perform your own analysis and risk assessment before making trading decisions.
Version: 1.0
Author: aaboomar
License: Mozilla Public License 2.0
A professional combination of two essential momentum indicators - Relative Strength Index (RSI) and Moving Average Convergence Divergence (MACD) - designed to provide comprehensive market analysis in a single, clean interface.
OVERVIEW
This indicator combines the power of RSI and MACD to help traders identify potential overbought/oversold conditions, momentum shifts, and trend changes. Both indicators are displayed with enhanced visual elements including gradient fills, customizable bands, and clear signal lines.
FEATURES
RSI (Relative Strength Index)
- Customizable Period: Adjustable RSI length (default: 14)
- Visual Zones: Overbought zone (above 70) with green gradient, Oversold zone (below 30) with red gradient, Background fill between bands for easy reference
- Key Levels: Clear horizontal lines at 30, 50, and 70
- Flexible Source: Choose any price source (close, open, high, low, etc.)
MACD (Moving Average Convergence Divergence)
- Customizable Parameters: Fast Length (default: 12), Slow Length (default: 26), Signal Length (default: 9)
- MA Type Selection: Choose between EMA or SMA for both oscillator and signal line
- Color-Coded Histogram: Green for bullish momentum, Red for bearish momentum
- Clear Signal Lines: Blue MACD line and orange Signal line for easy identification
ALERT CONDITIONS
The indicator includes 7 built-in alert conditions:
RSI Alerts:
1. RSI Overbought - Triggers when RSI crosses above 70
2. RSI Oversold - Triggers when RSI crosses below 30
3. RSI Midline Cross - Triggers when RSI crosses the 50 level
MACD Alerts:
4. MACD Bullish Cross - Triggers when MACD line crosses above Signal line
5. MACD Bearish Cross - Triggers when MACD line crosses below Signal line
6. MACD Histogram Bullish - Triggers when histogram crosses above zero
7. MACD Histogram Bearish - Triggers when histogram crosses below zero
CUSTOMIZATION
Clean Organization
- Inputs Tab: Separate groups for RSI and MACD settings
- Style Tab: All visual elements clearly labeled with "RSI -" or "MACD -" prefixes for easy identification
- Full Control: Customize colors, line widths, and visibility of all elements
Visual Clarity
- Professional color scheme optimized for both light and dark themes
- Gradient fills for intuitive zone identification
- Clear separation between RSI and MACD elements
SETTINGS
RSI Settings
- Length: Lookback period for RSI calculation (default: 14)
- Source: Price data to use for calculation (default: close)
MACD Settings
- Source: Price data to use for calculation (default: close)
- Fast Length: Period for fast moving average (default: 12)
- Slow Length: Period for slow moving average (default: 26)
- Signal Length: Period for signal line (default: 9)
- Oscillator MA Type: EMA or SMA for MACD calculation
- Signal MA Type: EMA or SMA for signal line
TECHNICAL DETAILS
- Pine Script Version: v6
- Indicator Type: Oscillator (subplot)
- Calculation Method: RSI uses Relative Strength Index with RMA smoothing, MACD uses Fast MA minus Slow MA with configurable MA types
- Input Validation: Built-in checks to ensure valid parameter combinations
NOTES
- Default settings are industry-standard values (RSI: 14, MACD: 12/26/9)
- All visual elements can be hidden/shown individually in the Style tab
- Alerts must be manually created by users through TradingView's alert system
- This indicator does not repaint - all signals are based on closed candles
WHO SHOULD USE THIS
- Day traders looking for momentum signals
- Swing traders identifying trend changes
- Technical analysts performing multi-indicator analysis
- Traders who want a clean, all-in-one momentum solution
DISCLAIMER
This indicator is for educational and informational purposes only. It does not constitute financial advice. Always perform your own analysis and risk assessment before making trading decisions.
Version: 1.0
Author: aaboomar
License: Mozilla Public License 2.0
开源脚本
秉承TradingView的精神,该脚本的作者将其开源,以便交易者可以查看和验证其功能。向作者致敬!您可以免费使用该脚本,但请记住,重新发布代码须遵守我们的网站规则。

免责声明
这些信息和出版物并非旨在提供,也不构成TradingView提供或认可的任何形式的财务、投资、交易或其他类型的建议或推荐。请阅读使用条款了解更多信息。
免责声明
这些信息和出版物并非旨在提供,也不构成TradingView提供或认可的任何形式的财务、投资、交易或其他类型的建议或推荐。请阅读使用条款了解更多信息。