VWAP [D/W/M]
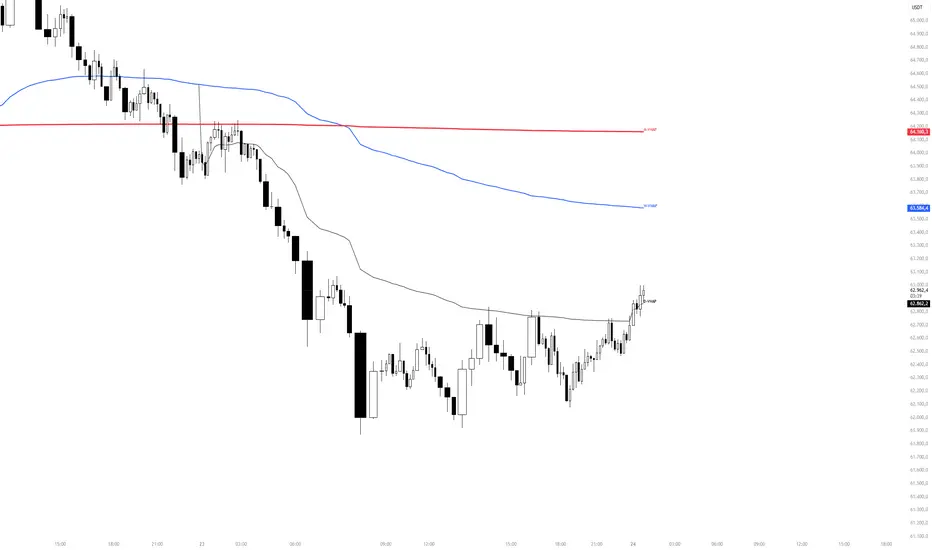
VWAP Suite [D/W/M]
OVERVIEW
VWAP Suite [D/W/M] plots Daily, Weekly, and Monthly Volume-Weighted Average Price on a single chart, with independent visibility, color, and line width for each. It's built for traders who use multiple VWAP anchors at once (e.g., daily VWAP for intraday context alongside weekly/monthly VWAP for higher-timeframe bias) without needing three separate indicators.
HOW IT WORKS
Each VWAP (Daily/Weekly/Monthly) is calculated as a running sum of typical price (hlc3) × volume, divided by cumulative volume, reset at the start of each new day/week/month. The calculation can run either on the chart's own timeframe or on an independently selected timeframe via request.security(), so a Daily VWAP can, for example, be calculated from 1-minute data even while viewing a 4-hour chart for a smoother, more accurate line.
To keep higher-timeframe charts uncluttered, each VWAP line has its own maximum display timeframe — once the chart timeframe exceeds that threshold, the corresponding line is automatically hidden (e.g., Daily VWAP only shows up to 30m by default, since a daily VWAP has little meaning on a weekly chart).
The script also includes a configurable alert system: it can fire when price comes within a chosen percentage distance of any of the three VWAPs, optionally restricted to a specific hour-range time window in a selectable timezone.
SETTINGS
- VWAP Display: toggle, color, and line width for Daily/Weekly/Monthly VWAP.
- Calculation Timeframe: per VWAP, choose "Chart" (use the chart's own timeframe) or an independent timeframe (seconds to 4h, or Daily) the VWAP is computed from.
- Display Timeframe Filter: maximum chart timeframe at which each VWAP line is still shown.
- Alerts: global time-window filter (active hours + timezone), minimum distance to VWAP (%) required to trigger, and individual enable switches for Daily/Weekly/Monthly alerts plus a combined "any VWAP" alert condition.
USAGE
Use the Daily VWAP as an intraday fair-value reference, and the Weekly/Monthly VWAPs as higher-timeframe trend/bias levels. Price holding above/below a VWAP is commonly read as directional bias; reactions at a VWAP (rejection, reclaim) are often used as confluence with other levels. The built-in alerts let you get notified when price approaches any of these levels without watching the chart continuously.
LIMITATIONS
- VWAP values calculated on a different (lower) timeframe via request.security() rely on that timeframe's data being available for the symbol.
- Like any cumulative VWAP, daily/weekly/monthly resets depend on the exchange's session and calendar data; behavior can vary slightly across symbols/exchanges with non-standard sessions.
- Alerts only evaluate while the script is running on an open chart, or via TradingView's standard alert infrastructure once configured from this indicator.
OVERVIEW
VWAP Suite [D/W/M] plots Daily, Weekly, and Monthly Volume-Weighted Average Price on a single chart, with independent visibility, color, and line width for each. It's built for traders who use multiple VWAP anchors at once (e.g., daily VWAP for intraday context alongside weekly/monthly VWAP for higher-timeframe bias) without needing three separate indicators.
HOW IT WORKS
Each VWAP (Daily/Weekly/Monthly) is calculated as a running sum of typical price (hlc3) × volume, divided by cumulative volume, reset at the start of each new day/week/month. The calculation can run either on the chart's own timeframe or on an independently selected timeframe via request.security(), so a Daily VWAP can, for example, be calculated from 1-minute data even while viewing a 4-hour chart for a smoother, more accurate line.
To keep higher-timeframe charts uncluttered, each VWAP line has its own maximum display timeframe — once the chart timeframe exceeds that threshold, the corresponding line is automatically hidden (e.g., Daily VWAP only shows up to 30m by default, since a daily VWAP has little meaning on a weekly chart).
The script also includes a configurable alert system: it can fire when price comes within a chosen percentage distance of any of the three VWAPs, optionally restricted to a specific hour-range time window in a selectable timezone.
SETTINGS
- VWAP Display: toggle, color, and line width for Daily/Weekly/Monthly VWAP.
- Calculation Timeframe: per VWAP, choose "Chart" (use the chart's own timeframe) or an independent timeframe (seconds to 4h, or Daily) the VWAP is computed from.
- Display Timeframe Filter: maximum chart timeframe at which each VWAP line is still shown.
- Alerts: global time-window filter (active hours + timezone), minimum distance to VWAP (%) required to trigger, and individual enable switches for Daily/Weekly/Monthly alerts plus a combined "any VWAP" alert condition.
USAGE
Use the Daily VWAP as an intraday fair-value reference, and the Weekly/Monthly VWAPs as higher-timeframe trend/bias levels. Price holding above/below a VWAP is commonly read as directional bias; reactions at a VWAP (rejection, reclaim) are often used as confluence with other levels. The built-in alerts let you get notified when price approaches any of these levels without watching the chart continuously.
LIMITATIONS
- VWAP values calculated on a different (lower) timeframe via request.security() rely on that timeframe's data being available for the symbol.
- Like any cumulative VWAP, daily/weekly/monthly resets depend on the exchange's session and calendar data; behavior can vary slightly across symbols/exchanges with non-standard sessions.
- Alerts only evaluate while the script is running on an open chart, or via TradingView's standard alert infrastructure once configured from this indicator.

免责声明
这些信息和出版物并非旨在提供,也不构成TradingView提供或认可的任何形式的财务、投资、交易或其他类型的建议或推荐。请阅读使用条款了解更多信息。