OPEN-SOURCE SCRIPT
Vix FIX dots
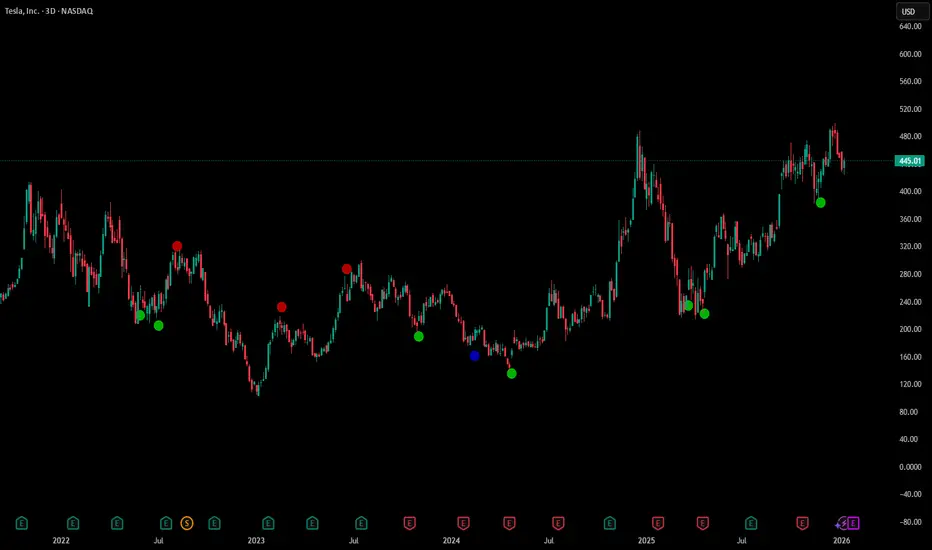
Description
Vix FIX Dots is a momentum and volatility-based trend-following tool. It combines the classic Williams VIX Fix logic with Stochastic and RSI filters to identify high-probability reversal points and trend exhaustion.
Unlike the standard VIX Fix which is often displayed in a separate pane, this script overlays signals directly onto your chart as colorful dots to simplify the decision-making process.
How it Works
The script calculates the "Synthetic VIX" (Williams VIX Fix) to find market bottoms and volatility peaks. To reduce noise and false signals, it incorporates price action filters and trend-strength lookbacks.
Signal Guide
The indicator plots four distinct types of dots:
Green Circle (Below Bar): Filtered Long Entry. This represents a standard buy signal where volatility has peaked and price action confirms a move up.
Blue Circle (Below Bar): Aggressive Long Entry. A faster signal for traders looking to catch a move earlier, based on multi-candle lookbacks.
Red Circle (Above Bar): Filtered Exit/Short. Indicates a standard trend exhaustion point.
Orange Circle (Above Bar): Aggressive Exit/Short. A faster signal indicating the trend may be rolling over.
Key Features
Volatility Bands: Uses Bollinger Bands and Percentile calculations on the VIX Fix to identify extreme exhaustion.
Price Action Filter: Signals only trigger if the current close outperforms a user-defined number of previous bars.
Customizable Lookbacks: Fully adjustable settings for Stochastic and RSI filters to match your specific timeframe (M5, H1, D1, etc.).
Vix FIX Dots is a momentum and volatility-based trend-following tool. It combines the classic Williams VIX Fix logic with Stochastic and RSI filters to identify high-probability reversal points and trend exhaustion.
Unlike the standard VIX Fix which is often displayed in a separate pane, this script overlays signals directly onto your chart as colorful dots to simplify the decision-making process.
How it Works
The script calculates the "Synthetic VIX" (Williams VIX Fix) to find market bottoms and volatility peaks. To reduce noise and false signals, it incorporates price action filters and trend-strength lookbacks.
Signal Guide
The indicator plots four distinct types of dots:
Green Circle (Below Bar): Filtered Long Entry. This represents a standard buy signal where volatility has peaked and price action confirms a move up.
Blue Circle (Below Bar): Aggressive Long Entry. A faster signal for traders looking to catch a move earlier, based on multi-candle lookbacks.
Red Circle (Above Bar): Filtered Exit/Short. Indicates a standard trend exhaustion point.
Orange Circle (Above Bar): Aggressive Exit/Short. A faster signal indicating the trend may be rolling over.
Key Features
Volatility Bands: Uses Bollinger Bands and Percentile calculations on the VIX Fix to identify extreme exhaustion.
Price Action Filter: Signals only trigger if the current close outperforms a user-defined number of previous bars.
Customizable Lookbacks: Fully adjustable settings for Stochastic and RSI filters to match your specific timeframe (M5, H1, D1, etc.).
开源脚本
秉承TradingView的精神,该脚本的作者将其开源,以便交易者可以查看和验证其功能。向作者致敬!您可以免费使用该脚本,但请记住,重新发布代码须遵守我们的网站规则。

免责声明
这些信息和出版物并非旨在提供,也不构成TradingView提供或认可的任何形式的财务、投资、交易或其他类型的建议或推荐。请阅读使用条款了解更多信息。
免责声明
这些信息和出版物并非旨在提供,也不构成TradingView提供或认可的任何形式的财务、投资、交易或其他类型的建议或推荐。请阅读使用条款了解更多信息。