OPEN-SOURCE SCRIPT
SMC Level Analyzer
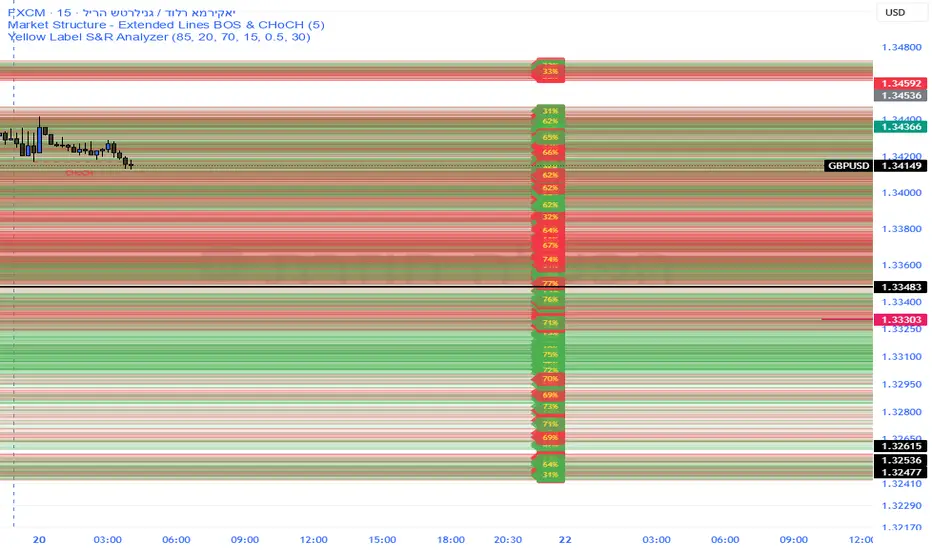
Precision S&R Strength – Indicator Description
Overview
The Precision S&R Strength analyzer is a sophisticated technical tool designed to identify and quantify the importance of Support and Resistance levels. Unlike standard pivot-point indicators, this script calculates a dynamic strength percentage for each level based on historical price interaction and accumulated trading volume.
Core Functionality
Smart Level Detection: Automatically identifies key high and low pivot points.
Volume & Touch Analysis: Each level is back-tested against the last 300 candles. The strength percentage (displayed on the right margin) is a weighted calculation of how many times the price reacted to the zone and the volume transacted at those prices.
Supply & Demand Zones: Visualizes levels as horizontal "boxes" (Zones) rather than simple lines, representing the actual price range where orders are clustered.
Clean Visuals: All data labels are anchored to the right-side margin, keeping the main chart clean and focused on price movement.
Strategic Purpose & Risk Warning
CRITICAL: This indicator is NOT a standalone "Buy/Sell" signal generator.
The primary goal of this tool is to act as a Confluence Factor (Secondary Confirmation) for your trading strategy. To trade successfully with this indicator, you must:
Analyze Price Action: Look for candlestick patterns (like pin bars or engulfing candles) near the highlighted zones.
Follow the Trend: Always align your trades with the overall market structure (Order Flow). A "90% strength" resistance level is more likely to break if the macro trend is strongly bullish.
Use as Confirmation: Use the strength percentage to filter out "weak" levels and focus only on high-probability zones where smart money has previously shown interest.
Trading involves significant risk. Never rely solely on a single indicator for execution.
Overview
The Precision S&R Strength analyzer is a sophisticated technical tool designed to identify and quantify the importance of Support and Resistance levels. Unlike standard pivot-point indicators, this script calculates a dynamic strength percentage for each level based on historical price interaction and accumulated trading volume.
Core Functionality
Smart Level Detection: Automatically identifies key high and low pivot points.
Volume & Touch Analysis: Each level is back-tested against the last 300 candles. The strength percentage (displayed on the right margin) is a weighted calculation of how many times the price reacted to the zone and the volume transacted at those prices.
Supply & Demand Zones: Visualizes levels as horizontal "boxes" (Zones) rather than simple lines, representing the actual price range where orders are clustered.
Clean Visuals: All data labels are anchored to the right-side margin, keeping the main chart clean and focused on price movement.
Strategic Purpose & Risk Warning
CRITICAL: This indicator is NOT a standalone "Buy/Sell" signal generator.
The primary goal of this tool is to act as a Confluence Factor (Secondary Confirmation) for your trading strategy. To trade successfully with this indicator, you must:
Analyze Price Action: Look for candlestick patterns (like pin bars or engulfing candles) near the highlighted zones.
Follow the Trend: Always align your trades with the overall market structure (Order Flow). A "90% strength" resistance level is more likely to break if the macro trend is strongly bullish.
Use as Confirmation: Use the strength percentage to filter out "weak" levels and focus only on high-probability zones where smart money has previously shown interest.
Trading involves significant risk. Never rely solely on a single indicator for execution.
开源脚本
秉承TradingView的精神,该脚本的作者将其开源,以便交易者可以查看和验证其功能。向作者致敬!您可以免费使用该脚本,但请记住,重新发布代码须遵守我们的网站规则。

免责声明
这些信息和出版物并非旨在提供,也不构成TradingView提供或认可的任何形式的财务、投资、交易或其他类型的建议或推荐。请阅读使用条款了解更多信息。
免责声明
这些信息和出版物并非旨在提供,也不构成TradingView提供或认可的任何形式的财务、投资、交易或其他类型的建议或推荐。请阅读使用条款了解更多信息。