Fair Value Gap (FVG) Statistics with Placebo Control
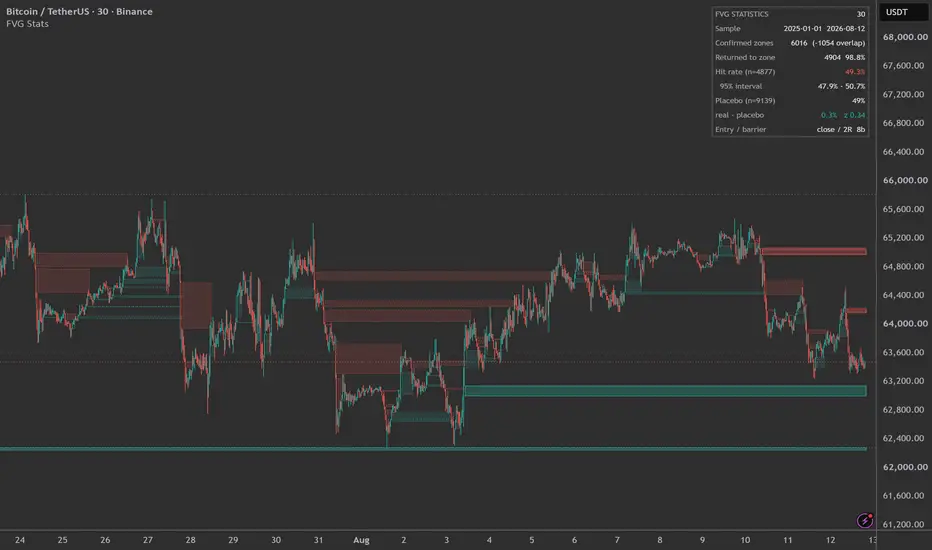
█ OVERVIEW
On the same instrument, measured against a 50% baseline, fair value gaps looked significantly profitable in one period and significantly unprofitable in another. Both readings were artifacts of a baseline that was never 50%.
This indicator measures what actually happens after price returns to a gap, then compares the result against fake, or placebo, zones of the same size placed at bars where no gap occurred. Because a hit rate tells you nothing until you know what a meaningless zone scores on the same chart.
The following description consists of two parts. Part 1 is written in plain English and covers everything most readers need. Part 2 contains the full methodology and results for anyone who wants to examine the numbers in detail.
═══════════════════════════════════════
PART 1 — WHAT THIS IS AND WHY
═══════════════════════════════════════
█ THE PROBLEM
Zone-based tools are everywhere: fair value gaps, order blocks, breakers, imbalances. Yet almost none of them tell you how often a zone actually led anywhere. And when a number is quoted, it is often built on one of three flawed foundations.
1. The zone is counted before it could have been known.
This problem is easiest to see with order blocks. An order block is commonly defined as the last opposite candle before a move that breaks structure. That means the block cannot be identified until the structure break occurs, often several bars later. Yet it is drawn back on the earlier candle as though it had been known at the time.
Any hit rate measured from that earlier candle therefore counts a zone that nobody could actually have traded.
Fair value gaps suffer less from this problem because their three-bar pattern completes quickly, but the same principle applies: a zone becomes active only when it becomes knowable, and nothing before that bar should be counted.
2. Failed zones disappear.
Many tools remove a zone from the chart once price has passed through it. That makes sense for keeping a chart clean. It is disastrous for statistics, because the zones being removed are disproportionately the ones that failed.
Count only what remains on the chart and you are counting the survivors.
3. The hit rate is compared with 50%.
This is the most important problem, and it is extremely common.
The reasoning seems straightforward: if the target and stop are equally far from the entry, then no edge should mean a 50/50 outcome.
But a rule that enters when price reaches a level inherits a baseline from the way price moves. That baseline is not necessarily 50%. It changes with the instrument, direction, and market conditions. Across the three markets tested here, it ranged from roughly 45% to 55%.
A hit rate by itself therefore tells you very little.
What matters is how the same measurement performs on zones that have no informational meaning at all.
█ WHAT THIS INDICATOR DOES
For every real fair value gap the indicator identifies, it also generates placebo zones of the same height, direction, and distance from price, anchored at bars where no fair value gap occurred.
Real and placebo zones are then measured by exactly the same rules.
The difference between them — real minus placebo — is the result that matters.
If real gaps perform like the placebo zones, then the pattern is not adding anything, regardless of how attractive the raw hit rate may look.
The placebo comparison does not ask whether fair value gaps win more than 50% of the time.
It asks a harder question:
█ HOW THE COMPARISON IS KEPT FAIR
Statistical libraries for Pine already exist, and many indicators will draw fair value gaps. What is not otherwise available is a matched control built into the measurement itself, so that every figure the indicator reports arrives together with the baseline it should be judged against.
Three design choices make that possible, and they only work together.
A matched placebo control. Each placebo zone has the same height, the same direction, and the same distance from price as the real zone it is meant to compare with. Both are scored by identical rules.
Confirmation-honest timing. A zone enters the sample only when it becomes knowable, never earlier. Every confirmed zone remains in the sample from that point onward, including zones that fail immediately.
Bias controls that are reported rather than hidden. Cases that are genuinely difficult to score — such as bars that touch both exits and trades that never resolve — are counted and displayed for real and placebo zones side by side. Ambiguous cases are treated conservatively rather than silently discarded.
The combination matters. A matched control is useful only if both sides are measured under the same timing and scoring rules.
█ WHAT THE TESTS FOUND
Across three asset classes, three timeframes, and two separate periods — fourteen measurements in total — fair value gaps showed no detectable advantage over size-matched zones placed at meaningless bars.
The difference remained below about one percentage point of hit rate, and none of the fourteen individual measurements reached conventional statistical significance.
That is a bound on what was observed, not a claim that the true effect is exactly zero.
A different market or a different period could produce a different result. That is precisely why the comparison is built into the tool rather than left as an assumption or a footnote.
The broader conclusion is more useful:
That lesson applies to zone-based tools generally, not only to fair value gaps.
If you take one thing from this script, take that.
█ HOW IT WAS TESTED
A single result on a single chart is easy to produce and easy to overinterpret. Before publication, the same measurement was therefore repeated while changing one assumption at a time.
Each of these choices is partly arbitrary. If a finding appears only under one particular setting, it may belong to the setting rather than to the market.
Fourteen separate measurements were made in total.
Two standard statistical tools are used. A confidence interval shows the range in which the underlying value plausibly lies, which is more informative than a single headline estimate. Results from independent markets are also combined so that their evidence can be considered together rather than one chart at a time.
The measurement procedure was additionally checked against artificial data for which the correct answer was known in advance. This allowed the method itself to be tested independently of any market result.
█ HOW TO READ AND USE THE INDICATOR
Add the indicator to any chart. It works on any symbol and any timeframe and needs no configuration to produce a result.
The panel
By default, the panel shows a compact view: the number of zones found, the number revisited by price, the hit rate with its confidence interval, the placebo baseline, and the difference between real and placebo.
Turn off Compact panel for the full breakdown: wins, losses, unresolved cases, the direction split, and side-by-side rates for the cases that are hardest to score.
Everything used to produce the headline result is available for inspection.
Reading the result
Check the sample size first. Below roughly 1000 resolved zones, the confidence interval is usually too wide to conclude much. Recognizing that the sample is inconclusive is a valid result, not a failure of the indicator. Lower timeframes and longer histories both increase the sample.
Then read real − placebo. That is the headline result.
A positive number means the gaps outperformed the placebo zones. A negative number means they underperformed them.
The z-score beside it indicates how far the observed difference sits from what chance alone can produce. As a rough guide, an absolute z-score below 2 is not conventionally distinguishable from noise.
The raw hit rate is shown for context, not as the answer. Judging the pattern from that number alone is the mistake this indicator is designed to expose.
Setting up a measurement
To measure a specific period, turn on Limit to date range and set the dates.
The panel reports the sample actually achieved. This can be shorter than the requested period if the chart has not loaded enough historical data, so scroll left when necessary to load more history.
To check whether a result depends on your choice of exits, change Barrier size and run the measurement again. A finding that appears only at one setting may belong to the setting rather than to the pattern.
As a chart indicator
Zones are drawn as they form and can also be used in the usual visual way.
A zone that price has not yet returned to is drawn solid and continues extending to the right while it remains open.
When price reaches the zone, the box stops extending and fades to a dotted outline. The width of a completed box therefore shows how long that gap survived before price returned to it, while the chart makes it easy to see which zones remain active.
Turning off Draw real zones leaves only the statistics panel.
█ SETTINGS
Measurement — Risk unit selects whether exit distance scales with ATR or with the zone's own height. Barrier size sets that distance. Time limit controls how many bars a trade may remain open before being recorded as unresolved.
Entry price and Evaluate exits on the entry bar provide alternative scoring conventions so their effect can be measured rather than assumed. Both are labeled where they introduce a known bias.
Minimum zone height filters out small gaps. Exclude overlapping zones and Overlap lookback prevent several gaps created by the same move from being treated as independent observations.
Sample — restricts the measurement to a date range, entered as year, month, and day so the sample remains reproducible.
Placebo control — Placebos per zone sets how many comparison zones each real zone generates; more placebos produce a tighter estimate of the baseline. Placebo offset controls how far from the original bar the comparison zones are anchored.
Validation — replaces market price with a random walk so the measurement can be checked against data whose correct answer is known in advance rather than only against real markets.
Display — Compact panel shows the headline rows only; turning it off reveals the full breakdown. Draw real zones toggles the boxes on the chart.
═══════════════════════════════════════
PART 2 — DETAILED ANALYSIS
═══════════════════════════════════════
█ HOW A ZONE IS SCORED
A gap becomes active on the bar after its three-bar pattern closes. From that point onward, every confirmed zone remains in the sample, including zones that fail immediately.
When price returns to a zone, the entry is recorded at that bar's close, not at the zone edge.
This matters more than it may appear.
A touch condition means that price reached or passed the edge, so the bar may have overshot it by an unknown amount. Assuming a fill at the edge while beginning the measurement only from the following bar would start the trade from an artificial price and can systematically distort the result.
Two exits are then placed at equal distances on either side of the entry. Because the exits are symmetric, real and placebo zones can be compared directly.
If one bar touches both exits, its open, high, low, and close do not reveal which level was reached first. Those cases are shown separately and counted as losses, making the published result the conservative one.
Zones that reach neither exit within the time limit are excluded from the hit-rate calculation. They did not resolve, so they provide no evidence for either outcome.
█ RESULTS
Results below use the following settings. The sample ends 1 August 2026.
Pine Script®
Three markets, 30-minute charts, 2025-01-01 to 2026-08-01:
Pine Script®
The panel on the chart above is not restricted to that fixed window — it runs to the most recent bar — so its figures differ slightly from the table. That is expected: it is a different sample, not a different result.
Read the raw column alone and the markets appear different: 49.5% for crypto versus 51.4% for currencies, a spread of 1.9 percentage points.
Now look at the placebo column. Its spread is 2.7 points.
The apparent difference between markets is therefore better explained by the baseline than by the fair value gaps themselves.
One example makes the problem especially clear:
Pine Script®
Against an assumed 50% baseline, a 54% hit rate gives a p-value near 0.003 — exactly the kind of number that can look compelling when published in isolation.
Against its observed control baseline, however, the evidence is not statistically significant.
The same indicator, on the same instrument, over a different period and with a tighter target, produced a raw hit rate of 48.4% with a z-score of -2.25 — apparently significant in the opposite direction.
Both apparent conclusions arise from comparing with an assumed 50% baseline rather than the observed control baseline.
█ ROBUSTNESS
Pine Script®
Across fourteen separate estimates of real minus placebo, the largest result was 1.49 standard errors from zero.
With fourteen estimates, even if the true effect were zero, the largest absolute result would be expected to reach roughly 1.9 standard errors by chance alone.
Pooled across three independent markets, the estimate was -0.04 percentage points, with a 95% interval of approximately -1.2 to +1.1 points.
█ LIMITATIONS
One symbol and one timeframe can be analyzed per chart. Pine cannot pool results across markets, so each chart represents one sample rather than proof by itself. The pooled figures reported above were combined separately.
Trading costs are not included. Entries assume execution at the bar close with no spread, commission, or slippage. Real-world trading costs would make absolute performance worse.
Ambiguous bars are counted as losses. This lowers both real and placebo hit rates by roughly the ambiguous-case rate and therefore tends to cancel when the difference between them is calculated.
The bull and bear rows should not be interpreted independently in a trending market.
The placebo control matches zone size, direction, and distance from price, but it cannot match the fact that a real gap forms immediately after a strong move in the same direction.
For example, in an uptrend, a fake bearish zone is more likely to be run over by the prevailing trend, whereas a real bearish gap can only form after an actual downward move. These effects work in opposite directions and largely cancel in the combined result.
For that reason, the total should be treated as the primary statistic rather than the directional split.
This limitation was identified during testing and is the main known weakness of the methodology.
Finally, all results come from a sample. Another market or another period may produce a different estimate. That uncertainty is the reason the placebo comparison is built into the indicator rather than assumed away.
█ METHOD AND PRIOR WORK
None of the statistics here are new, and it is worth being clear about that.
Assigning a treatment to units or moments where it did not actually occur, then checking that no effect appears, is a standard falsification test in causal inference, where it is usually called a placebo test. The placebo zones in this indicator are that idea applied to bars instead of subjects.
The trading application is not new either. David Aronson's Evidence-Based Technical Analysis (2006) argues that a rule should be judged against the returns of random entry signals rather than against zero, and uses Monte Carlo permutation and White's Reality Check to do it.
The scoring rule — a target, a stop, and a time limit, whichever is reached first — is the triple-barrier method described by Marcos López de Prado.
What this script adds is not the method but its availability. The control is generated and scored automatically alongside the real zones, on any chart and any symbol, so the baseline arrives together with the number instead of requiring a separate study that most people will never run.
█ OPEN SOURCE
The source is open. Every figure above can be reproduced — or shown to be wrong — by anyone who wants to check it.
Order blocks are next, measured by the same rule: from the bar that breaks structure, not from the earlier candle on which the block is drawn.
On the same instrument, measured against a 50% baseline, fair value gaps looked significantly profitable in one period and significantly unprofitable in another. Both readings were artifacts of a baseline that was never 50%.
This indicator measures what actually happens after price returns to a gap, then compares the result against fake, or placebo, zones of the same size placed at bars where no gap occurred. Because a hit rate tells you nothing until you know what a meaningless zone scores on the same chart.
The following description consists of two parts. Part 1 is written in plain English and covers everything most readers need. Part 2 contains the full methodology and results for anyone who wants to examine the numbers in detail.
═══════════════════════════════════════
PART 1 — WHAT THIS IS AND WHY
═══════════════════════════════════════
█ THE PROBLEM
Zone-based tools are everywhere: fair value gaps, order blocks, breakers, imbalances. Yet almost none of them tell you how often a zone actually led anywhere. And when a number is quoted, it is often built on one of three flawed foundations.
1. The zone is counted before it could have been known.
This problem is easiest to see with order blocks. An order block is commonly defined as the last opposite candle before a move that breaks structure. That means the block cannot be identified until the structure break occurs, often several bars later. Yet it is drawn back on the earlier candle as though it had been known at the time.
Any hit rate measured from that earlier candle therefore counts a zone that nobody could actually have traded.
Fair value gaps suffer less from this problem because their three-bar pattern completes quickly, but the same principle applies: a zone becomes active only when it becomes knowable, and nothing before that bar should be counted.
2. Failed zones disappear.
Many tools remove a zone from the chart once price has passed through it. That makes sense for keeping a chart clean. It is disastrous for statistics, because the zones being removed are disproportionately the ones that failed.
Count only what remains on the chart and you are counting the survivors.
3. The hit rate is compared with 50%.
This is the most important problem, and it is extremely common.
The reasoning seems straightforward: if the target and stop are equally far from the entry, then no edge should mean a 50/50 outcome.
But a rule that enters when price reaches a level inherits a baseline from the way price moves. That baseline is not necessarily 50%. It changes with the instrument, direction, and market conditions. Across the three markets tested here, it ranged from roughly 45% to 55%.
A hit rate by itself therefore tells you very little.
What matters is how the same measurement performs on zones that have no informational meaning at all.
█ WHAT THIS INDICATOR DOES
For every real fair value gap the indicator identifies, it also generates placebo zones of the same height, direction, and distance from price, anchored at bars where no fair value gap occurred.
Real and placebo zones are then measured by exactly the same rules.
The difference between them — real minus placebo — is the result that matters.
If real gaps perform like the placebo zones, then the pattern is not adding anything, regardless of how attractive the raw hit rate may look.
The placebo comparison does not ask whether fair value gaps win more than 50% of the time.
It asks a harder question:
Do fair value gaps perform better than comparable zones that carry no fair value gap information at all?
█ HOW THE COMPARISON IS KEPT FAIR
Statistical libraries for Pine already exist, and many indicators will draw fair value gaps. What is not otherwise available is a matched control built into the measurement itself, so that every figure the indicator reports arrives together with the baseline it should be judged against.
Three design choices make that possible, and they only work together.
A matched placebo control. Each placebo zone has the same height, the same direction, and the same distance from price as the real zone it is meant to compare with. Both are scored by identical rules.
Confirmation-honest timing. A zone enters the sample only when it becomes knowable, never earlier. Every confirmed zone remains in the sample from that point onward, including zones that fail immediately.
Bias controls that are reported rather than hidden. Cases that are genuinely difficult to score — such as bars that touch both exits and trades that never resolve — are counted and displayed for real and placebo zones side by side. Ambiguous cases are treated conservatively rather than silently discarded.
The combination matters. A matched control is useful only if both sides are measured under the same timing and scoring rules.
█ WHAT THE TESTS FOUND
Across three asset classes, three timeframes, and two separate periods — fourteen measurements in total — fair value gaps showed no detectable advantage over size-matched zones placed at meaningless bars.
The difference remained below about one percentage point of hit rate, and none of the fourteen individual measurements reached conventional statistical significance.
That is a bound on what was observed, not a claim that the true effect is exactly zero.
A different market or a different period could produce a different result. That is precisely why the comparison is built into the tool rather than left as an assumption or a footnote.
The broader conclusion is more useful:
A hit rate quoted without its baseline does not tell you whether something works. On the same instrument, measured against 50%, this pattern looked significantly profitable in one period and significantly unprofitable in another. Both readings were created by the baseline, not by the gaps.
That lesson applies to zone-based tools generally, not only to fair value gaps.
If you take one thing from this script, take that.
█ HOW IT WAS TESTED
A single result on a single chart is easy to produce and easy to overinterpret. Before publication, the same measurement was therefore repeated while changing one assumption at a time.
- Three asset classes — crypto, currencies, and equity index futures
- Three timeframes — 5 minutes, 30 minutes, and 1 hour
- Two separate, non-overlapping time periods
- Three different target and stop distances
- Two different limits on how long a trade could remain open
Each of these choices is partly arbitrary. If a finding appears only under one particular setting, it may belong to the setting rather than to the market.
Fourteen separate measurements were made in total.
Two standard statistical tools are used. A confidence interval shows the range in which the underlying value plausibly lies, which is more informative than a single headline estimate. Results from independent markets are also combined so that their evidence can be considered together rather than one chart at a time.
The measurement procedure was additionally checked against artificial data for which the correct answer was known in advance. This allowed the method itself to be tested independently of any market result.
█ HOW TO READ AND USE THE INDICATOR
Add the indicator to any chart. It works on any symbol and any timeframe and needs no configuration to produce a result.
The panel
By default, the panel shows a compact view: the number of zones found, the number revisited by price, the hit rate with its confidence interval, the placebo baseline, and the difference between real and placebo.
Turn off Compact panel for the full breakdown: wins, losses, unresolved cases, the direction split, and side-by-side rates for the cases that are hardest to score.
Everything used to produce the headline result is available for inspection.
Reading the result
Check the sample size first. Below roughly 1000 resolved zones, the confidence interval is usually too wide to conclude much. Recognizing that the sample is inconclusive is a valid result, not a failure of the indicator. Lower timeframes and longer histories both increase the sample.
Then read real − placebo. That is the headline result.
A positive number means the gaps outperformed the placebo zones. A negative number means they underperformed them.
The z-score beside it indicates how far the observed difference sits from what chance alone can produce. As a rough guide, an absolute z-score below 2 is not conventionally distinguishable from noise.
The raw hit rate is shown for context, not as the answer. Judging the pattern from that number alone is the mistake this indicator is designed to expose.
Setting up a measurement
To measure a specific period, turn on Limit to date range and set the dates.
The panel reports the sample actually achieved. This can be shorter than the requested period if the chart has not loaded enough historical data, so scroll left when necessary to load more history.
To check whether a result depends on your choice of exits, change Barrier size and run the measurement again. A finding that appears only at one setting may belong to the setting rather than to the pattern.
As a chart indicator
Zones are drawn as they form and can also be used in the usual visual way.
A zone that price has not yet returned to is drawn solid and continues extending to the right while it remains open.
When price reaches the zone, the box stops extending and fades to a dotted outline. The width of a completed box therefore shows how long that gap survived before price returned to it, while the chart makes it easy to see which zones remain active.
Turning off Draw real zones leaves only the statistics panel.
█ SETTINGS
Measurement — Risk unit selects whether exit distance scales with ATR or with the zone's own height. Barrier size sets that distance. Time limit controls how many bars a trade may remain open before being recorded as unresolved.
Entry price and Evaluate exits on the entry bar provide alternative scoring conventions so their effect can be measured rather than assumed. Both are labeled where they introduce a known bias.
Minimum zone height filters out small gaps. Exclude overlapping zones and Overlap lookback prevent several gaps created by the same move from being treated as independent observations.
Sample — restricts the measurement to a date range, entered as year, month, and day so the sample remains reproducible.
Placebo control — Placebos per zone sets how many comparison zones each real zone generates; more placebos produce a tighter estimate of the baseline. Placebo offset controls how far from the original bar the comparison zones are anchored.
Validation — replaces market price with a random walk so the measurement can be checked against data whose correct answer is known in advance rather than only against real markets.
Display — Compact panel shows the headline rows only; turning it off reveals the full breakdown. Draw real zones toggles the boxes on the chart.
═══════════════════════════════════════
PART 2 — DETAILED ANALYSIS
═══════════════════════════════════════
█ HOW A ZONE IS SCORED
A gap becomes active on the bar after its three-bar pattern closes. From that point onward, every confirmed zone remains in the sample, including zones that fail immediately.
When price returns to a zone, the entry is recorded at that bar's close, not at the zone edge.
This matters more than it may appear.
A touch condition means that price reached or passed the edge, so the bar may have overshot it by an unknown amount. Assuming a fill at the edge while beginning the measurement only from the following bar would start the trade from an artificial price and can systematically distort the result.
Two exits are then placed at equal distances on either side of the entry. Because the exits are symmetric, real and placebo zones can be compared directly.
If one bar touches both exits, its open, high, low, and close do not reveal which level was reached first. Those cases are shown separately and counted as losses, making the published result the conservative one.
Zones that reach neither exit within the time limit are excluded from the hit-rate calculation. They did not resolve, so they provide no evidence for either outcome.
█ RESULTS
Results below use the following settings. The sample ends 1 August 2026.
Three markets, 30-minute charts, 2025-01-01 to 2026-08-01:
The panel on the chart above is not restricted to that fixed window — it runs to the most recent bar — so its figures differ slightly from the table. That is expected: it is a different sample, not a different result.
Read the raw column alone and the markets appear different: 49.5% for crypto versus 51.4% for currencies, a spread of 1.9 percentage points.
Now look at the placebo column. Its spread is 2.7 points.
The apparent difference between markets is therefore better explained by the baseline than by the fair value gaps themselves.
One example makes the problem especially clear:
Against an assumed 50% baseline, a 54% hit rate gives a p-value near 0.003 — exactly the kind of number that can look compelling when published in isolation.
Against its observed control baseline, however, the evidence is not statistically significant.
The same indicator, on the same instrument, over a different period and with a tighter target, produced a raw hit rate of 48.4% with a z-score of -2.25 — apparently significant in the opposite direction.
Both apparent conclusions arise from comparing with an assumed 50% baseline rather than the observed control baseline.
█ ROBUSTNESS
Across fourteen separate estimates of real minus placebo, the largest result was 1.49 standard errors from zero.
With fourteen estimates, even if the true effect were zero, the largest absolute result would be expected to reach roughly 1.9 standard errors by chance alone.
Pooled across three independent markets, the estimate was -0.04 percentage points, with a 95% interval of approximately -1.2 to +1.1 points.
█ LIMITATIONS
One symbol and one timeframe can be analyzed per chart. Pine cannot pool results across markets, so each chart represents one sample rather than proof by itself. The pooled figures reported above were combined separately.
Trading costs are not included. Entries assume execution at the bar close with no spread, commission, or slippage. Real-world trading costs would make absolute performance worse.
Ambiguous bars are counted as losses. This lowers both real and placebo hit rates by roughly the ambiguous-case rate and therefore tends to cancel when the difference between them is calculated.
The bull and bear rows should not be interpreted independently in a trending market.
The placebo control matches zone size, direction, and distance from price, but it cannot match the fact that a real gap forms immediately after a strong move in the same direction.
For example, in an uptrend, a fake bearish zone is more likely to be run over by the prevailing trend, whereas a real bearish gap can only form after an actual downward move. These effects work in opposite directions and largely cancel in the combined result.
For that reason, the total should be treated as the primary statistic rather than the directional split.
This limitation was identified during testing and is the main known weakness of the methodology.
Finally, all results come from a sample. Another market or another period may produce a different estimate. That uncertainty is the reason the placebo comparison is built into the indicator rather than assumed away.
█ METHOD AND PRIOR WORK
None of the statistics here are new, and it is worth being clear about that.
Assigning a treatment to units or moments where it did not actually occur, then checking that no effect appears, is a standard falsification test in causal inference, where it is usually called a placebo test. The placebo zones in this indicator are that idea applied to bars instead of subjects.
The trading application is not new either. David Aronson's Evidence-Based Technical Analysis (2006) argues that a rule should be judged against the returns of random entry signals rather than against zero, and uses Monte Carlo permutation and White's Reality Check to do it.
The scoring rule — a target, a stop, and a time limit, whichever is reached first — is the triple-barrier method described by Marcos López de Prado.
What this script adds is not the method but its availability. The control is generated and scored automatically alongside the real zones, on any chart and any symbol, so the baseline arrives together with the number instead of requiring a separate study that most people will never run.
█ OPEN SOURCE
The source is open. Every figure above can be reproduced — or shown to be wrong — by anyone who wants to check it.
Order blocks are next, measured by the same rule: from the bar that breaks structure, not from the earlier candle on which the block is drawn.

Algolego Studio · independent, placebo-controlled reviews of backtested strategies, in plain language · algolegostudio.com."
免责声明
这些信息和出版物并非旨在提供,也不构成TradingView提供或认可的任何形式的财务、投资、交易或其他类型的建议或推荐。请阅读使用条款了解更多信息。
Algolego Studio · independent, placebo-controlled reviews of backtested strategies, in plain language · algolegostudio.com."
免责声明
这些信息和出版物并非旨在提供,也不构成TradingView提供或认可的任何形式的财务、投资、交易或其他类型的建议或推荐。请阅读使用条款了解更多信息。