Trendline Breakout Daily Stats
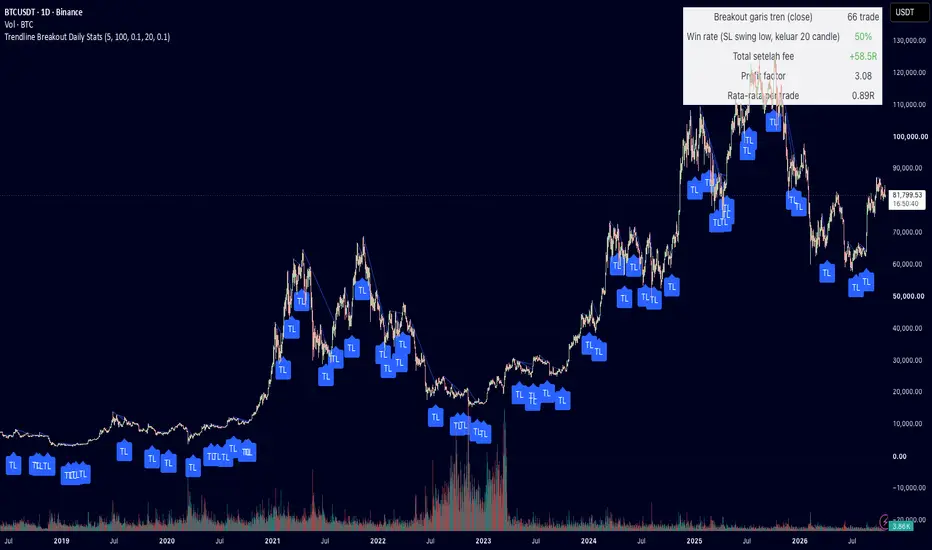
Trendline Breakout Daily Stats draws descending trendlines automatically, marks the first candle that closes above a line, simulates a trade for each breakout, and shows the results in a statistics panel. It was built for the daily timeframe.
Rules (all thresholds are inputs):
- Pivot high: the highest high with 5 candles on each side.
- Trendline: drawn through two consecutive pivot highs where the second is lower than the first; no high between them may exceed the line by more than 0.1%.
- Breakout: the first close above the line, at least 5 candles after the second pivot and within 100 candles of it.
Trade simulation:
- Entry at the next candle open, stop loss at the lowest low since the second pivot, exit at the close of the 20th candle (input) or at the stop. Stop is checked first within a candle.
- Fees of 0.1% per side are deducted in R.
- The panel shows trades, win rate, total R after fees, profit factor and average R per trade for the selected date range.
Notes: a line becomes available only after its second pivot is confirmed (5 candles later), and breakouts are evaluated on closed candles, so signals do not repaint. Historical statistics only; not a trading recommendation.
Rules (all thresholds are inputs):
- Pivot high: the highest high with 5 candles on each side.
- Trendline: drawn through two consecutive pivot highs where the second is lower than the first; no high between them may exceed the line by more than 0.1%.
- Breakout: the first close above the line, at least 5 candles after the second pivot and within 100 candles of it.
Trade simulation:
- Entry at the next candle open, stop loss at the lowest low since the second pivot, exit at the close of the 20th candle (input) or at the stop. Stop is checked first within a candle.
- Fees of 0.1% per side are deducted in R.
- The panel shows trades, win rate, total R after fees, profit factor and average R per trade for the selected date range.
Notes: a line becomes available only after its second pivot is confirmed (5 candles later), and breakouts are evaluated on closed candles, so signals do not repaint. Historical statistics only; not a trading recommendation.

免责声明
这些信息和出版物并非旨在提供,也不构成TradingView提供或认可的任何形式的财务、投资、交易或其他类型的建议或推荐。请阅读使用条款了解更多信息。
免责声明
这些信息和出版物并非旨在提供,也不构成TradingView提供或认可的任何形式的财务、投资、交易或其他类型的建议或推荐。请阅读使用条款了解更多信息。