OPEN-SOURCE SCRIPT
Advanced First + Red + 12:45 Breakout Indicator
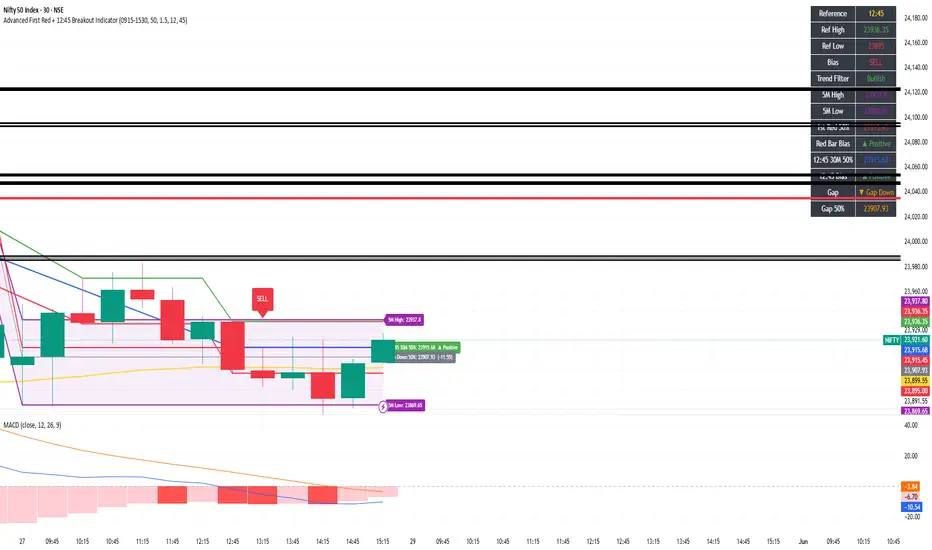
Here's a description you can use when publishing this indicator on TradingView:
---
**Advanced First Red + 12:45 Breakout Indicator**
This multi-timeframe intraday indicator is built for NSE/BSE traders and combines several powerful confluence levels into a single overlay, helping you identify bias, breakout opportunities, and key institutional price zones — all visible consistently across any chart timeframe.
---
**What this indicator does:**
**🟣 First 5-Min Candle Zone (Purple Cloud)**
Marks the high and low of the opening 9:15 AM candle on the 5-minute timeframe as purple horizontal lines with a shaded cloud between them. When price is trapped inside this zone, the market is range-bound. A breakout above or below signals the start of a directional move.
**🔴 First Red Bar 50% Level (Red Line)**
Identifies the first red (bearish) candle of the day on the 5-minute timeframe and marks its 50% midpoint with a solid red horizontal line. Price above this line = positive/bullish bias. Price below = negative/bearish bias. Resets every trading day.
**🔵 12:45 PM Candle 50% Level (Blue Line)**
Fetches the 12:45 PM candle from the 30-minute timeframe and marks its midpoint with a solid blue line. This level acts as a mid-session bias filter — useful for afternoon trades. Shows "Pending" until 12:45 PM is reached.
**⚫ Gap 50% Level (Grey Line)**
Calculates the gap between yesterday's close and today's open, and marks the exact 50% retracement of that gap with a solid grey line. Colour-coded — lime for gap up, orange for gap down. A key magnet level that price frequently revisits during the session.
**🟢🔴 First Red / 12:45 Breakout Strategy**
The core breakout engine captures either the first red candle of the day or the 12:45 PM candle (configurable) as reference levels. Buy signals trigger when price crosses above the reference high with bullish EMA confirmation. Sell signals trigger on a cross below the reference low with bearish confirmation. Entry, stoploss, and target levels are plotted automatically based on your chosen Risk:Reward ratio.
**📊 Dashboard (Top Right)**
A clean real-time table displays all key levels and bias readings in one place: Reference candle, Ref High/Low, Strategy Bias, EMA Trend Filter, 5M High/Low, 1st Red 50% bias, 12:45 30M 50% bias, Gap direction, and Gap 50% level.
---
**Key Features:**
- All levels fetched via `request.security()` — fully timeframe-independent, visible on 1-min, 3-min, 5-min, 15-min, and higher charts
- Optional EMA trend filter (default 50 EMA) to avoid counter-trend trades
- Toggle each feature on/off independently via inputs
- Right-edge labels on every level showing price and current bias
- 10 built-in alert conditions covering breakouts, bias flips, and gap fills
- Works on any NSE/BSE instrument — index, futures, or stocks
---
**Recommended Timeframes:** 1-min, 3-min, 5-min, 15-min
**Best used with:** Nifty 50, Bank Nifty, Sensex, or liquid large-cap stocks during Indian market hours (9:15 AM – 3:30 PM IST)
---
*Code generated using PineGPT — marketcalls.in*
*© algostudio — Published under Mozilla Public License 2.0*
---
**Advanced First Red + 12:45 Breakout Indicator**
This multi-timeframe intraday indicator is built for NSE/BSE traders and combines several powerful confluence levels into a single overlay, helping you identify bias, breakout opportunities, and key institutional price zones — all visible consistently across any chart timeframe.
---
**What this indicator does:**
**🟣 First 5-Min Candle Zone (Purple Cloud)**
Marks the high and low of the opening 9:15 AM candle on the 5-minute timeframe as purple horizontal lines with a shaded cloud between them. When price is trapped inside this zone, the market is range-bound. A breakout above or below signals the start of a directional move.
**🔴 First Red Bar 50% Level (Red Line)**
Identifies the first red (bearish) candle of the day on the 5-minute timeframe and marks its 50% midpoint with a solid red horizontal line. Price above this line = positive/bullish bias. Price below = negative/bearish bias. Resets every trading day.
**🔵 12:45 PM Candle 50% Level (Blue Line)**
Fetches the 12:45 PM candle from the 30-minute timeframe and marks its midpoint with a solid blue line. This level acts as a mid-session bias filter — useful for afternoon trades. Shows "Pending" until 12:45 PM is reached.
**⚫ Gap 50% Level (Grey Line)**
Calculates the gap between yesterday's close and today's open, and marks the exact 50% retracement of that gap with a solid grey line. Colour-coded — lime for gap up, orange for gap down. A key magnet level that price frequently revisits during the session.
**🟢🔴 First Red / 12:45 Breakout Strategy**
The core breakout engine captures either the first red candle of the day or the 12:45 PM candle (configurable) as reference levels. Buy signals trigger when price crosses above the reference high with bullish EMA confirmation. Sell signals trigger on a cross below the reference low with bearish confirmation. Entry, stoploss, and target levels are plotted automatically based on your chosen Risk:Reward ratio.
**📊 Dashboard (Top Right)**
A clean real-time table displays all key levels and bias readings in one place: Reference candle, Ref High/Low, Strategy Bias, EMA Trend Filter, 5M High/Low, 1st Red 50% bias, 12:45 30M 50% bias, Gap direction, and Gap 50% level.
---
**Key Features:**
- All levels fetched via `request.security()` — fully timeframe-independent, visible on 1-min, 3-min, 5-min, 15-min, and higher charts
- Optional EMA trend filter (default 50 EMA) to avoid counter-trend trades
- Toggle each feature on/off independently via inputs
- Right-edge labels on every level showing price and current bias
- 10 built-in alert conditions covering breakouts, bias flips, and gap fills
- Works on any NSE/BSE instrument — index, futures, or stocks
---
**Recommended Timeframes:** 1-min, 3-min, 5-min, 15-min
**Best used with:** Nifty 50, Bank Nifty, Sensex, or liquid large-cap stocks during Indian market hours (9:15 AM – 3:30 PM IST)
---
*Code generated using PineGPT — marketcalls.in*
*© algostudio — Published under Mozilla Public License 2.0*
开源脚本
秉承TradingView的精神,该脚本的作者将其开源,以便交易者可以查看和验证其功能。向作者致敬!您可以免费使用该脚本,但请记住,重新发布代码须遵守我们的网站规则。

免责声明
这些信息和出版物并非旨在提供,也不构成TradingView提供或认可的任何形式的财务、投资、交易或其他类型的建议或推荐。请阅读使用条款了解更多信息。
开源脚本
秉承TradingView的精神,该脚本的作者将其开源,以便交易者可以查看和验证其功能。向作者致敬!您可以免费使用该脚本,但请记住,重新发布代码须遵守我们的网站规则。
免责声明
这些信息和出版物并非旨在提供,也不构成TradingView提供或认可的任何形式的财务、投资、交易或其他类型的建议或推荐。请阅读使用条款了解更多信息。