已更新
CQ_(0)_[PRICE ACTION / CALCULATED LEVELS] v1
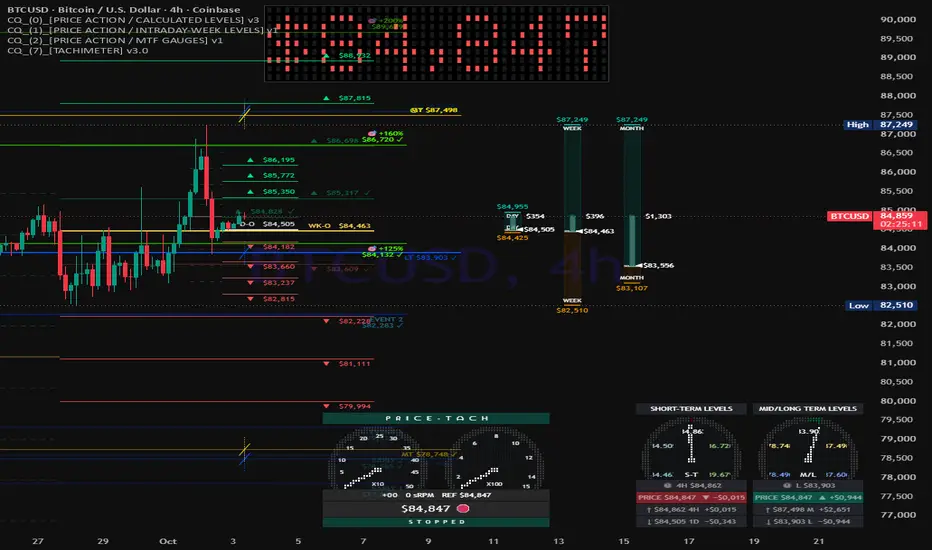
================================================================================
CQ_(0)_[PRICE ACTION / CALCULATED LEVELS] v1
Description & User Manual
Pine Script v6 indicator for TradingView - (c) CQuevedo345
================================================================================
TABLE OF CONTENTS
-----------------
1. Description
2. Quick Start
3. How the Indicator Draws (Important)
4. Global Display Settings
4.1 Start Markers
4.2 Global Label Offsets
4.3 Label Text Color
4.4 Caption Mode (Labels / Boxes)
4.5 Reached Marker (checkmark)
5. Entry / Target Events
5.1 Set 1 - Automatic (ZigZag leg)
5.2 Set 2 - Manual
6. Mid-Term Targets
7. Long-Term Targets (Macro Ranges)
8. Yearly Open Lines
9. Reference Price Levels (I - X)
9.1 Global Reference Settings
9.2 Per-Level Settings
9.3 Shading Between Levels
9.4 Alerts
10. Dynamic Opacity (Near / Mid / Far)
11. Summary Tables
11.1 Table Layout (shared)
11.2 Mid/Long-Term Table
11.3 Short-Term Table
11.4 Merged Table
11.5 Reading the NOW Column
12. Row Suffix Legend
13. Performance Tips
14. Troubleshooting / FAQ
================================================================================
1. DESCRIPTION
================================================================================
CQ_(0)_[PRICE ACTION / CALCULATED LEVELS] is an overlay indicator that plots
three independent families of price levels on the chart and summarizes them
in one or two ranked tables:
1) MID / LONG-TERM TARGETS
- Mid-Term: an automatic price ladder = Anchor x Multipliers, anchored by
default to the OPEN of the current year.
- Long-Term: an automatic Fibonacci ladder projected from up to three
macro ranges (cycle Low -> cycle High / ATH), with optional merging of
confluent rungs.
- Current-Year Open and Previous-Year Open axis lines.
2) ENTRY / TARGET EVENTS
- Set 1: filled AUTOMATICALLY from the last CONFIRMED leg of a zigzag
(Entry = 40/50/60/100 %, Target = 125/160/200 %).
- Set 2: typed manually as comma-separated price lists.
3) REFERENCE LEVELS
- Up to 10 fully independent manual price levels, each with its own
color, width, style, line-start behavior, description and proximity
alert. The gaps between consecutive levels can be shaded with a color
gradient.
Every level is drawn as the same visual trio: a horizontal line, a small
start marker (solid tick + dotted vertical tick), and a price caption.
Captions can be classic pointer labels or thin "box captions" that ride on
the line itself.
Levels closest to the current price are drawn most opaque; levels further
away fade out. The same ranking drives the summary tables, so a line on the
chart and its row in the table always share the same emphasis.
A checkmark (✓) marks any level that price has traded through within a
configurable lookback, both on the chart and in the tables.
================================================================================
2. QUICK START
================================================================================
1. Add the indicator to a chart (designed around BTC, but works on any
symbol; the Long-Term range defaults are BTC prices).
2. Mid-Term, Long-Term, Yearly Opens and Set 1 work out of the box - no
typing required.
3. Optional: type your own prices into Set 2 (comma separated, no spaces)
and/or into any of the 10 Reference Levels.
4. Pick Caption Mode (Boxes or Labels) and adjust the Label Offsets so the
captions sit where you like.
5. Choose how the tables are shown (two separate tables, or one merged
table) in the TABLE - LAYOUT group.
6. Optional: create alerts for "REF LEVEL n APPROACH".
================================================================================
3. HOW THE INDICATOR DRAWS (IMPORTANT)
================================================================================
- Lines, captions, markers and shading are drawn ONLY on the live,
unclosed realtime bar. They are deleted and redrawn on every tick.
Consequence: when the market is closed or no realtime data is arriving,
the chart levels will not appear until the next live tick. The summary
tables are built on the last bar and appear regardless.
- The indicator can hold up to 500 lines, 500 labels and 500 boxes.
Gradient shading is the biggest consumer (each band = 2 lines + 1 fill),
so many shaded gaps with high "Gradient Smoothness" can exhaust the line
budget.
- Mid/Long-Term lines extend indefinitely to the LEFT from the current bar.
Entry/Target lines start 48 bars back. Reference Level lines start
according to each level's "Line Start Mode".
================================================================================
4. GLOBAL DISPLAY SETTINGS
================================================================================
4.1 START MARKERS (group: A L L - L E V E L S - S T A R T - M A R K E R S)
-----------------------------------------------------------------------------
Bar Length ......... Length (bars) of the solid tick at each level's start.
0 - 10, default 1.
Width .............. Thickness of that tick. Default 1.
% Length ........... Height of the dotted vertical tick, as % of price.
Default 0.4 %.
Width .............. Thickness of the dotted tick. Default 1.
4.2 GLOBAL LABEL OFFSETS (group: G L O B A L - L A B E L - O F F S E T S)
-----------------------------------------------------------------------------
One offset per level family, in bars to the right of the current bar.
Labels Offset - Entry-Target Events ...... default 35
Labels Offset - Reference Levels (I-X) ... default 35
Labels Offset - Mid/Long-Term ............ default 45
(also used by Yearly Opens)
In Boxes caption mode with Right alignment, captions end at this offset.
4.3 LABEL TEXT COLOR (group: L A B E L - T E X T - C O L O R)
-----------------------------------------------------------------------------
Custom Text Color For All Labels
OFF (default): each caption picks its own text color automatically
(black or white for contrast against its background, or
the level's own color in Boxes mode).
ON: every chart caption uses the chosen color.
The near/mid/far opacity still fades the text either way. Tables are not
affected by this setting.
4.4 CAPTION MODE (group: C A P T I O N - M O D E)
-----------------------------------------------------------------------------
Caption Mode
Labels ... classic pointer labels placed to the right of each line.
Boxes .... (default) a thin box spanning the line from its start to the
label offset, with the price text riding on the line. Text
uses the level's own color. Box height scales with price.
Align (Boxes only)
Right (default) - text ends at the label offset (line tip).
Left - text starts at the line's start bar.
Center - text centered along the line.
Side (Boxes only)
Away From Price (default) - captions of levels at/above price read ABOVE
their line; levels below price read BELOW.
Above / Below - force every caption to one side.
Note: Reference Level description labels always stay as labels.
4.5 REACHED MARKER (group: R E A C H E D M A R K E R)
-----------------------------------------------------------------------------
Show ✓ On Reached Labels ... appends " ✓" to any chart caption whose price
was traded through (between a bar's high and
low) within the lookback.
Reached Lookback (Months) .. default 6. Converted to bars for the current
timeframe automatically (capped at 4999 bars,
so on high timeframes the effective window
may be shorter than requested).
================================================================================
5. ENTRY / TARGET EVENTS
================================================================================
Both sets share:
Label Palette ... background color scheme for Entry/Target captions of
BOTH sets: Classic, Ocean, Sunset, Neon, Monochrome,
Desert, Oldbook, OldWest, Default. Entry captions use the
palette's red tone, Target captions its green tone.
Lines keep their own Line Color.
Line width ...... taken from the Long-Term "Width" input.
Label offset .... "Labels Offset - Entry-Target Events".
5.1 SET 1 - AUTOMATIC (group: E N T R Y - A N D - T A R G E T - E V E N T S)
-----------------------------------------------------------------------------
PLOT [4H SHORTER GRADE (More Noise)] ... show/hide Set 1.
Levels are computed from the last CONFIRMED zigzag leg - the leg before
the one still developing. Its two pivots are locked, so these levels only
change when a new pivot confirms.
Auto Levels - ZigZag Period ... zigzag lookback in bars (default 45),
on the chart timeframe.
Invert
OFF (default): 0 % = leg end (last confirmed pivot), 100 % = leg start.
40/50/60 % read as retracements; 125/160/200 % extend
beyond the leg start.
ON: 0 % = leg start, 100 % = leg end; targets project
forward in the leg's direction.
Levels produced (rounded to whole numbers):
Entry: 40 % -> "EARLY 1"
50 % -> "EARLY 2"
60 % -> "EVENT 1"
100 % -> "EVENT 2"
Target: 125 % -> "🎯+125%"
160 % -> "🎯+160%"
200 % -> "🎯+200%"
Set 1 needs at least three zigzag pivots before any level appears.
Line Color / Text Color ... for Entry lines and for Target lines.
Display Mode .............. Constant (always visible) or Interval (blinks).
Show (sec) / Hide (sec) ... blink timing for Interval mode (5 / 2).
5.2 SET 2 - MANUAL (group: E N T R Y - A N D - T A R G E T - E V E N T S - 2)
-----------------------------------------------------------------------------
PLOT [4H LARGER GRADE (Less Noise)] ... show/hide Set 2.
Entry Event [4H LARGER GRADE] ......... comma-separated prices, NO spaces.
e.g. 98500,97200,95800
Event Target (Set 2) .................. comma-separated prices, NO spaces.
Line Color / Text Color ............... for Entry and Target lines.
Display Mode / Show / Hide ............ same as Set 1.
Entry captions count EVENT 1, EVENT 2, EVENT 3 ...
Target captions count +25 %, +50 %, +100 %, +125 %, +150 % ...
(75 % is intentionally skipped).
Note: the price lists are read once when the script loads; after editing
them, the indicator reloads automatically when you press OK.
================================================================================
6. MID-TERM TARGETS (group: M I D - T E R M - T A R G E T S)
================================================================================
Show toggle: "Mid Term" in S H O W / H I D E - M I D / L O N G - T E R M.
(The Mid/Long-Term table still includes these rows even when hidden.)
Anchor Override (0 = Year Open)
0 (default) - anchor = open of the current year (updates each new year).
> 0 - uses this price as the anchor instead.
Targets - Multipliers
Comma-separated multipliers; one level per multiplier:
level = anchor x multiplier
Default: 0.4,0.5,0.6,0.7,0.8,0.9,1.0,1.1,1.2,1.3,1.4,1.5,1.6
Mid Term Color / Width ... line and caption style. Width is also used by
the Yearly Open lines.
Caption prefix: "MT $...".
================================================================================
7. LONG-TERM TARGETS - MACRO RANGES (group: L O N G - T E R M - T A R G E T S)
================================================================================
Show toggle: "Long Term" in S H O W / H I D E - M I D / L O N G - T E R M.
NOTE: this toggle ALSO shows/hides the Current-Year and Previous-Year Open
lines.
Each enabled range produces one rung per ratio:
level = Low + ratio x (High - Low)
ratio < 1 = retracement inside the range
ratio = 1 = the High
ratio > 1 = extension beyond the High
Use Weekly ATH For All Ranges ... replaces every range's High with the
symbol's all-time high (highest WEEKLY
high). Extensions recalculate at each
new ATH.
Range A / B / C .................. enable toggle, "Auto High = ATH"
(per-range ATH override), Low, High.
Defaults:
A (ON) Low 15,476 High 126,199 (Nov 2022 low -> Oct 2025 ATH)
B (ON) Low 49,000 High 126,199 (Aug 2024 low -> Oct 2025 ATH)
C (OFF) Low 3,122 High 69,000 (Dec 2018 low -> Nov 2021 ATH)
A range is skipped if its High is not above its Low.
Ratio List ....................... default "0.382, 0.5, 0.618, 1, 1.5,
1.618, 2". Spaces allowed; invalid
entries skipped; rungs <= 0 dropped.
Merge Confluence / Tolerance % ... ON (default 0.75 %): rungs from two or
more DIFFERENT ranges within tolerance
merge into one rung at their average.
Rungs of the same range never merge.
Long Term Label Color / Width .... line and caption style.
Caption prefix: "LT $...". All rungs are rounded to whole dollars.
================================================================================
8. YEARLY OPEN LINES (group: Y E A R L Y - O P E N - L I N E S)
================================================================================
Show Current Year Open + Color .... caption "⨀Y $...".
Show Previous Year Open + Color ... caption "⨀PY $...".
Both require the "Long Term" show toggle to be ON to appear on the chart.
Each also adds a row to the Mid/Long-Term table when its own toggle is ON.
================================================================================
9. REFERENCE PRICE LEVELS (I - X)
================================================================================
9.1 GLOBAL REFERENCE SETTINGS (group: R E F E R E N C E - P R I C E - L E V E L S)
-----------------------------------------------------------------------------
Start N days in the past ........ default 14. Anchor point for Fixed mode
and the search window for Pivot /
↤Candle modes (and their fallback).
Pivot Lookback (bars each side) . default 5. Bars on each side required for
a confirmed swing high/low (Pivot mode).
Pivot Price Tolerance ($) ....... default 250. A pivot only matches a level
if its price is within this many dollars.
9.2 PER-LEVEL SETTINGS (groups: R E F E R E N C E - L E V E L - [ I ] ... [ X ])
-----------------------------------------------------------------------------
Price Level n ............... manual price. 0.0 = disabled/hidden.
Description (above label) ... optional short text shown just above the
caption (always a label, in both modes).
Color / Width / Style ....... Solid, Dotted or Dashed.
Line Start Mode
Fixed ..... line extends indefinitely to the left.
Pivot ..... line starts at the most recent confirmed swing high/low
priced within the Pivot Price Tolerance of this level.
Falls back to "N days back" if none is found.
↤Candle ... (default) line starts at the nearest bar to the left whose
candle BODY (open/close, wicks ignored) touches the price.
Falls back to "N days back" if none is found.
Alert Dist ($) .............. proximity distance for this level's alert
(default 250).
Caption: "$price" (+ " ✓" if reached). Offset: Reference Levels offset.
9.3 SHADING BETWEEN LEVELS (group: R E F E R E N C E - L E V E L - S H A D I N G)
-----------------------------------------------------------------------------
Shade Ref I <-> II ... Shade Ref IX <-> X
Nine independent toggles. Fills the gap between two consecutive levels
with a gradient blended from their two colors. Both levels must have a
price set. The shade starts at the earlier of the two levels' start bars.
Gradient Smoothness (Bands) ... 2 - 50, default 20. More = smoother, but
each band costs 2 lines + 1 fill.
Shade Transparency ............ 50 - 95, default 85.
9.4 ALERTS
-----------------------------------------------------------------------------
Ten alert conditions: "REF LEVEL 1 APPROACH" ... "REF LEVEL 10 APPROACH".
Each fires while |close - level| <= that level's Alert Dist ($).
To use: Create Alert -> Condition = this indicator -> pick the level.
A level left at 0.0 never triggers.
================================================================================
10. DYNAMIC OPACITY (NEAR / MID / FAR)
================================================================================
Every chart line and caption is faded by its RANK distance to the current
price, computed separately for levels above and below price:
nearest level on each side ...... "Nearest Levels Opacity %" (100)
second-nearest on each side ..... "Next Levels Opacity %" (50)
all others ...................... "Remaining Levels Opacity %" (20)
- Mid-Term, Long-Term and Yearly Open lines use the Mid/Long-Term Table
percentages and are ranked against each other.
- Set 1/2 Entry/Target and Reference Levels use the Short-Term Table
percentages and are ranked against the groups currently INCLUDED in the
Short-Term table (see 11.3 include toggles). The automatic 1D/1W/4H open
rows have no chart line of their own.
- In the tables, "far" rows also drop to tiny text.
================================================================================
11. SUMMARY TABLES
================================================================================
Each table has three columns (Vertical) or three rows (Horizontal):
NOW ...... current-price marker (on one row only - see 11.5).
TARGET ... every price of that ladder, sorted highest -> lowest, shaded
with the level's own color and rank-based opacity.
✅ ....... "✓" if price traded through the level within the table's own
Reached Lookback.
11.1 TABLE LAYOUT (group: T A B L E - L A Y O U T)
-----------------------------------------------------------------------------
Column Order (Separate Tables) ... "NOW | TARGET | ✓" or "✓ | TARGET | NOW"
(in Horizontal, swaps the rows).
Merge Both Tables Into One ....... see 11.4.
Merged NOW Column Side
Left / Top ......... one combined NOW column first.
Right / Bottom ..... one combined NOW column last.
Split .............. each ladder gets its own NOW column next to its
TARGET column (M/L on the left/top, S/T on the
right/bottom).
Merged Table Title / Orientation / Position / Text Size.
11.2 MID/LONG-TERM TABLE (group: M I D / L O N G - T E R M T A B L E)
-----------------------------------------------------------------------------
Rows: Mid-Term (M), Long-Term (L), Current-Year Open (Y) and Previous-Year
Open (PY, each following its own show toggle). Mid/Long rows are included
even if their chart lines are hidden.
Show Table, Table Title, Title Background, Now Column Background,
Orientation (Vertical/Horizontal), Position, Text Size,
Nearest / Next / Remaining Opacity % (100 / 50 / 20),
Reached Lookback (Months) - ✓ Column (6),
✓ Column Marker Color,
Now Column Marker Color (▲ Below Midpoint) / (▼ Above Midpoint),
Header Background (also the flat background of the ✓ column).
11.3 SHORT-TERM TABLE (group: S H O R T - T E R M - T A B L E)
-----------------------------------------------------------------------------
Same settings as 11.2, plus:
Include toggles (all ON by default):
Set 1 Entry Events (E1), Set 1 Targets (T1),
Set 2 Entry Events (E2), Set 2 Targets (T2),
Reference Levels (R1-R10).
Turning a group OFF removes its rows from the table AND from the opacity
ranking pool of the chart lines - it does NOT hide the lines themselves
(use each group's own Plot toggle for that).
Automatic open rows (table only, no chart line):
Show 1D Open + Color ... current daily candle's open.
Show 1W Open + Color ... current weekly candle's open.
Show 4H Open + Color ... current 4H candle's open.
11.4 MERGED TABLE
-----------------------------------------------------------------------------
When "Merge Both Tables Into One" is ON, the two separate tables are
replaced by one table:
NOW | M/L ✓ | M/L TARGET | S/T TARGET | S/T ✓ (Left / Top)
M/L ✓ | M/L TARGET | S/T TARGET | S/T ✓ | NOW (Right / Bottom)
M/L ✓ | M/L NOW | M/L TARGET | S/T TARGET | S/T NOW | S/T ✓ (Split)
The two ladders are vertically offset so both NOW markers land on the SAME
row. The combined NOW cell shows:
M/L ➕/➖ distance
⨀ current price
S/T ➕/➖ distance
A ladder whose own "Show Table" is OFF is left out. The merged table uses
the Mid/Long-Term title/NOW backgrounds; each ladder keeps its own header
color and opacity settings.
11.5 READING THE NOW COLUMN
-----------------------------------------------------------------------------
The indicator finds the nearest level ABOVE price and the nearest level
BELOW price and takes the midpoint between them.
- Price at or BELOW the midpoint -> marker on the BELOW level's row:
↱ CURRENT price
➕$distance⁝ (dollars price is above that level)
- Price ABOVE the midpoint -> marker on the ABOVE level's row:
➖$distance⁝ (dollars price is still below that level)
↳CURRENT price
In short: the marker sits on whichever bracketing level price is closer
to. If price is beyond every level on one side (no bracketing pair), the
NOW column is blank and the title shows "Price Off Limits".
================================================================================
12. ROW SUFFIX LEGEND
================================================================================
M ..... Mid-Term target E1 .... Set 1 Entry
L ..... Long-Term target E2 .... Set 2 Entry
Y ..... Current-Year Open T1 .... Set 1 Target
PY .... Previous-Year Open T2 .... Set 2 Target
1D .... Daily open R1-R10 Reference Levels I - X
1W .... Weekly open 4H .... 4-hour open
Chart caption prefixes: MT (Mid-Term), LT (Long-Term), ⨀Y, ⨀PY,
EARLY n / EVENT n (entries), 🎯+n% (targets).
================================================================================
13. PERFORMANCE TIPS
================================================================================
- The heaviest per-tick work is the ↤Candle / Pivot start-bar search of
Reference Levels, which scans back up to "Start N days in the past"
worth of bars per level. On low timeframes (1m-5m) with many levels:
* lower "Start N days in the past", or
* switch busy levels to "Fixed" mode.
- Unused levels (price 0.0) cost nothing.
- Keep "Gradient Smoothness" modest when shading several gaps.
- The 4H and 1D open rows only request data when their toggles are ON.
================================================================================
14. TROUBLESHOOTING / FAQ
================================================================================
Q: The tables show, but no lines appear.
A: Chart levels only draw on live realtime ticks. Wait for the next tick
or check that the market is open / data is streaming.
Q: Set 1 levels are missing.
A: The zigzag needs at least three pivots. Try a smaller ZigZag Period or
load more history. Also check "PLOT [4H SHORTER GRADE]" is ON.
Q: Set 2 prices don't show.
A: Use commas with no spaces, numbers only (no $ or thousands separators).
Q: The Yearly Open lines disappeared.
A: They also require the "Long Term" show toggle to be ON.
Q: A Reference Level line starts too far left / right.
A: Change its Line Start Mode (Fixed / Pivot / ↤Candle), or adjust
"Start N days in the past", "Pivot Lookback" or "Pivot Price Tolerance".
Q: Some lines or shades vanish when many features are on.
A: The 500-line limit was reached. Reduce shading bands, shaded gaps, or
the number of ratios/multipliers.
Q: Why does a hidden group still affect opacity?
A: Chart visibility and table inclusion are separate. Ranking follows the
Short-Term table include toggles, not the Plot toggles.
Q: Long-Term rungs look wrong for my symbol.
A: The range defaults are BTC prices. Enter the Low/High of your own
symbol's macro ranges, or enable "Use Weekly ATH For All Ranges".
================================================================================
End of manual
================================================================================
CQ_(0)_[PRICE ACTION / CALCULATED LEVELS] v1
Description & User Manual
Pine Script v6 indicator for TradingView - (c) CQuevedo345
================================================================================
TABLE OF CONTENTS
-----------------
1. Description
2. Quick Start
3. How the Indicator Draws (Important)
4. Global Display Settings
4.1 Start Markers
4.2 Global Label Offsets
4.3 Label Text Color
4.4 Caption Mode (Labels / Boxes)
4.5 Reached Marker (checkmark)
5. Entry / Target Events
5.1 Set 1 - Automatic (ZigZag leg)
5.2 Set 2 - Manual
6. Mid-Term Targets
7. Long-Term Targets (Macro Ranges)
8. Yearly Open Lines
9. Reference Price Levels (I - X)
9.1 Global Reference Settings
9.2 Per-Level Settings
9.3 Shading Between Levels
9.4 Alerts
10. Dynamic Opacity (Near / Mid / Far)
11. Summary Tables
11.1 Table Layout (shared)
11.2 Mid/Long-Term Table
11.3 Short-Term Table
11.4 Merged Table
11.5 Reading the NOW Column
12. Row Suffix Legend
13. Performance Tips
14. Troubleshooting / FAQ
================================================================================
1. DESCRIPTION
================================================================================
CQ_(0)_[PRICE ACTION / CALCULATED LEVELS] is an overlay indicator that plots
three independent families of price levels on the chart and summarizes them
in one or two ranked tables:
1) MID / LONG-TERM TARGETS
- Mid-Term: an automatic price ladder = Anchor x Multipliers, anchored by
default to the OPEN of the current year.
- Long-Term: an automatic Fibonacci ladder projected from up to three
macro ranges (cycle Low -> cycle High / ATH), with optional merging of
confluent rungs.
- Current-Year Open and Previous-Year Open axis lines.
2) ENTRY / TARGET EVENTS
- Set 1: filled AUTOMATICALLY from the last CONFIRMED leg of a zigzag
(Entry = 40/50/60/100 %, Target = 125/160/200 %).
- Set 2: typed manually as comma-separated price lists.
3) REFERENCE LEVELS
- Up to 10 fully independent manual price levels, each with its own
color, width, style, line-start behavior, description and proximity
alert. The gaps between consecutive levels can be shaded with a color
gradient.
Every level is drawn as the same visual trio: a horizontal line, a small
start marker (solid tick + dotted vertical tick), and a price caption.
Captions can be classic pointer labels or thin "box captions" that ride on
the line itself.
Levels closest to the current price are drawn most opaque; levels further
away fade out. The same ranking drives the summary tables, so a line on the
chart and its row in the table always share the same emphasis.
A checkmark (✓) marks any level that price has traded through within a
configurable lookback, both on the chart and in the tables.
================================================================================
2. QUICK START
================================================================================
1. Add the indicator to a chart (designed around BTC, but works on any
symbol; the Long-Term range defaults are BTC prices).
2. Mid-Term, Long-Term, Yearly Opens and Set 1 work out of the box - no
typing required.
3. Optional: type your own prices into Set 2 (comma separated, no spaces)
and/or into any of the 10 Reference Levels.
4. Pick Caption Mode (Boxes or Labels) and adjust the Label Offsets so the
captions sit where you like.
5. Choose how the tables are shown (two separate tables, or one merged
table) in the TABLE - LAYOUT group.
6. Optional: create alerts for "REF LEVEL n APPROACH".
================================================================================
3. HOW THE INDICATOR DRAWS (IMPORTANT)
================================================================================
- Lines, captions, markers and shading are drawn ONLY on the live,
unclosed realtime bar. They are deleted and redrawn on every tick.
Consequence: when the market is closed or no realtime data is arriving,
the chart levels will not appear until the next live tick. The summary
tables are built on the last bar and appear regardless.
- The indicator can hold up to 500 lines, 500 labels and 500 boxes.
Gradient shading is the biggest consumer (each band = 2 lines + 1 fill),
so many shaded gaps with high "Gradient Smoothness" can exhaust the line
budget.
- Mid/Long-Term lines extend indefinitely to the LEFT from the current bar.
Entry/Target lines start 48 bars back. Reference Level lines start
according to each level's "Line Start Mode".
================================================================================
4. GLOBAL DISPLAY SETTINGS
================================================================================
4.1 START MARKERS (group: A L L - L E V E L S - S T A R T - M A R K E R S)
-----------------------------------------------------------------------------
Bar Length ......... Length (bars) of the solid tick at each level's start.
0 - 10, default 1.
Width .............. Thickness of that tick. Default 1.
% Length ........... Height of the dotted vertical tick, as % of price.
Default 0.4 %.
Width .............. Thickness of the dotted tick. Default 1.
4.2 GLOBAL LABEL OFFSETS (group: G L O B A L - L A B E L - O F F S E T S)
-----------------------------------------------------------------------------
One offset per level family, in bars to the right of the current bar.
Labels Offset - Entry-Target Events ...... default 35
Labels Offset - Reference Levels (I-X) ... default 35
Labels Offset - Mid/Long-Term ............ default 45
(also used by Yearly Opens)
In Boxes caption mode with Right alignment, captions end at this offset.
4.3 LABEL TEXT COLOR (group: L A B E L - T E X T - C O L O R)
-----------------------------------------------------------------------------
Custom Text Color For All Labels
OFF (default): each caption picks its own text color automatically
(black or white for contrast against its background, or
the level's own color in Boxes mode).
ON: every chart caption uses the chosen color.
The near/mid/far opacity still fades the text either way. Tables are not
affected by this setting.
4.4 CAPTION MODE (group: C A P T I O N - M O D E)
-----------------------------------------------------------------------------
Caption Mode
Labels ... classic pointer labels placed to the right of each line.
Boxes .... (default) a thin box spanning the line from its start to the
label offset, with the price text riding on the line. Text
uses the level's own color. Box height scales with price.
Align (Boxes only)
Right (default) - text ends at the label offset (line tip).
Left - text starts at the line's start bar.
Center - text centered along the line.
Side (Boxes only)
Away From Price (default) - captions of levels at/above price read ABOVE
their line; levels below price read BELOW.
Above / Below - force every caption to one side.
Note: Reference Level description labels always stay as labels.
4.5 REACHED MARKER (group: R E A C H E D M A R K E R)
-----------------------------------------------------------------------------
Show ✓ On Reached Labels ... appends " ✓" to any chart caption whose price
was traded through (between a bar's high and
low) within the lookback.
Reached Lookback (Months) .. default 6. Converted to bars for the current
timeframe automatically (capped at 4999 bars,
so on high timeframes the effective window
may be shorter than requested).
================================================================================
5. ENTRY / TARGET EVENTS
================================================================================
Both sets share:
Label Palette ... background color scheme for Entry/Target captions of
BOTH sets: Classic, Ocean, Sunset, Neon, Monochrome,
Desert, Oldbook, OldWest, Default. Entry captions use the
palette's red tone, Target captions its green tone.
Lines keep their own Line Color.
Line width ...... taken from the Long-Term "Width" input.
Label offset .... "Labels Offset - Entry-Target Events".
5.1 SET 1 - AUTOMATIC (group: E N T R Y - A N D - T A R G E T - E V E N T S)
-----------------------------------------------------------------------------
PLOT [4H SHORTER GRADE (More Noise)] ... show/hide Set 1.
Levels are computed from the last CONFIRMED zigzag leg - the leg before
the one still developing. Its two pivots are locked, so these levels only
change when a new pivot confirms.
Auto Levels - ZigZag Period ... zigzag lookback in bars (default 45),
on the chart timeframe.
Invert
OFF (default): 0 % = leg end (last confirmed pivot), 100 % = leg start.
40/50/60 % read as retracements; 125/160/200 % extend
beyond the leg start.
ON: 0 % = leg start, 100 % = leg end; targets project
forward in the leg's direction.
Levels produced (rounded to whole numbers):
Entry: 40 % -> "EARLY 1"
50 % -> "EARLY 2"
60 % -> "EVENT 1"
100 % -> "EVENT 2"
Target: 125 % -> "🎯+125%"
160 % -> "🎯+160%"
200 % -> "🎯+200%"
Set 1 needs at least three zigzag pivots before any level appears.
Line Color / Text Color ... for Entry lines and for Target lines.
Display Mode .............. Constant (always visible) or Interval (blinks).
Show (sec) / Hide (sec) ... blink timing for Interval mode (5 / 2).
5.2 SET 2 - MANUAL (group: E N T R Y - A N D - T A R G E T - E V E N T S - 2)
-----------------------------------------------------------------------------
PLOT [4H LARGER GRADE (Less Noise)] ... show/hide Set 2.
Entry Event [4H LARGER GRADE] ......... comma-separated prices, NO spaces.
e.g. 98500,97200,95800
Event Target (Set 2) .................. comma-separated prices, NO spaces.
Line Color / Text Color ............... for Entry and Target lines.
Display Mode / Show / Hide ............ same as Set 1.
Entry captions count EVENT 1, EVENT 2, EVENT 3 ...
Target captions count +25 %, +50 %, +100 %, +125 %, +150 % ...
(75 % is intentionally skipped).
Note: the price lists are read once when the script loads; after editing
them, the indicator reloads automatically when you press OK.
================================================================================
6. MID-TERM TARGETS (group: M I D - T E R M - T A R G E T S)
================================================================================
Show toggle: "Mid Term" in S H O W / H I D E - M I D / L O N G - T E R M.
(The Mid/Long-Term table still includes these rows even when hidden.)
Anchor Override (0 = Year Open)
0 (default) - anchor = open of the current year (updates each new year).
> 0 - uses this price as the anchor instead.
Targets - Multipliers
Comma-separated multipliers; one level per multiplier:
level = anchor x multiplier
Default: 0.4,0.5,0.6,0.7,0.8,0.9,1.0,1.1,1.2,1.3,1.4,1.5,1.6
Mid Term Color / Width ... line and caption style. Width is also used by
the Yearly Open lines.
Caption prefix: "MT $...".
================================================================================
7. LONG-TERM TARGETS - MACRO RANGES (group: L O N G - T E R M - T A R G E T S)
================================================================================
Show toggle: "Long Term" in S H O W / H I D E - M I D / L O N G - T E R M.
NOTE: this toggle ALSO shows/hides the Current-Year and Previous-Year Open
lines.
Each enabled range produces one rung per ratio:
level = Low + ratio x (High - Low)
ratio < 1 = retracement inside the range
ratio = 1 = the High
ratio > 1 = extension beyond the High
Use Weekly ATH For All Ranges ... replaces every range's High with the
symbol's all-time high (highest WEEKLY
high). Extensions recalculate at each
new ATH.
Range A / B / C .................. enable toggle, "Auto High = ATH"
(per-range ATH override), Low, High.
Defaults:
A (ON) Low 15,476 High 126,199 (Nov 2022 low -> Oct 2025 ATH)
B (ON) Low 49,000 High 126,199 (Aug 2024 low -> Oct 2025 ATH)
C (OFF) Low 3,122 High 69,000 (Dec 2018 low -> Nov 2021 ATH)
A range is skipped if its High is not above its Low.
Ratio List ....................... default "0.382, 0.5, 0.618, 1, 1.5,
1.618, 2". Spaces allowed; invalid
entries skipped; rungs <= 0 dropped.
Merge Confluence / Tolerance % ... ON (default 0.75 %): rungs from two or
more DIFFERENT ranges within tolerance
merge into one rung at their average.
Rungs of the same range never merge.
Long Term Label Color / Width .... line and caption style.
Caption prefix: "LT $...". All rungs are rounded to whole dollars.
================================================================================
8. YEARLY OPEN LINES (group: Y E A R L Y - O P E N - L I N E S)
================================================================================
Show Current Year Open + Color .... caption "⨀Y $...".
Show Previous Year Open + Color ... caption "⨀PY $...".
Both require the "Long Term" show toggle to be ON to appear on the chart.
Each also adds a row to the Mid/Long-Term table when its own toggle is ON.
================================================================================
9. REFERENCE PRICE LEVELS (I - X)
================================================================================
9.1 GLOBAL REFERENCE SETTINGS (group: R E F E R E N C E - P R I C E - L E V E L S)
-----------------------------------------------------------------------------
Start N days in the past ........ default 14. Anchor point for Fixed mode
and the search window for Pivot /
↤Candle modes (and their fallback).
Pivot Lookback (bars each side) . default 5. Bars on each side required for
a confirmed swing high/low (Pivot mode).
Pivot Price Tolerance ($) ....... default 250. A pivot only matches a level
if its price is within this many dollars.
9.2 PER-LEVEL SETTINGS (groups: R E F E R E N C E - L E V E L - [ I ] ... [ X ])
-----------------------------------------------------------------------------
Price Level n ............... manual price. 0.0 = disabled/hidden.
Description (above label) ... optional short text shown just above the
caption (always a label, in both modes).
Color / Width / Style ....... Solid, Dotted or Dashed.
Line Start Mode
Fixed ..... line extends indefinitely to the left.
Pivot ..... line starts at the most recent confirmed swing high/low
priced within the Pivot Price Tolerance of this level.
Falls back to "N days back" if none is found.
↤Candle ... (default) line starts at the nearest bar to the left whose
candle BODY (open/close, wicks ignored) touches the price.
Falls back to "N days back" if none is found.
Alert Dist ($) .............. proximity distance for this level's alert
(default 250).
Caption: "$price" (+ " ✓" if reached). Offset: Reference Levels offset.
9.3 SHADING BETWEEN LEVELS (group: R E F E R E N C E - L E V E L - S H A D I N G)
-----------------------------------------------------------------------------
Shade Ref I <-> II ... Shade Ref IX <-> X
Nine independent toggles. Fills the gap between two consecutive levels
with a gradient blended from their two colors. Both levels must have a
price set. The shade starts at the earlier of the two levels' start bars.
Gradient Smoothness (Bands) ... 2 - 50, default 20. More = smoother, but
each band costs 2 lines + 1 fill.
Shade Transparency ............ 50 - 95, default 85.
9.4 ALERTS
-----------------------------------------------------------------------------
Ten alert conditions: "REF LEVEL 1 APPROACH" ... "REF LEVEL 10 APPROACH".
Each fires while |close - level| <= that level's Alert Dist ($).
To use: Create Alert -> Condition = this indicator -> pick the level.
A level left at 0.0 never triggers.
================================================================================
10. DYNAMIC OPACITY (NEAR / MID / FAR)
================================================================================
Every chart line and caption is faded by its RANK distance to the current
price, computed separately for levels above and below price:
nearest level on each side ...... "Nearest Levels Opacity %" (100)
second-nearest on each side ..... "Next Levels Opacity %" (50)
all others ...................... "Remaining Levels Opacity %" (20)
- Mid-Term, Long-Term and Yearly Open lines use the Mid/Long-Term Table
percentages and are ranked against each other.
- Set 1/2 Entry/Target and Reference Levels use the Short-Term Table
percentages and are ranked against the groups currently INCLUDED in the
Short-Term table (see 11.3 include toggles). The automatic 1D/1W/4H open
rows have no chart line of their own.
- In the tables, "far" rows also drop to tiny text.
================================================================================
11. SUMMARY TABLES
================================================================================
Each table has three columns (Vertical) or three rows (Horizontal):
NOW ...... current-price marker (on one row only - see 11.5).
TARGET ... every price of that ladder, sorted highest -> lowest, shaded
with the level's own color and rank-based opacity.
✅ ....... "✓" if price traded through the level within the table's own
Reached Lookback.
11.1 TABLE LAYOUT (group: T A B L E - L A Y O U T)
-----------------------------------------------------------------------------
Column Order (Separate Tables) ... "NOW | TARGET | ✓" or "✓ | TARGET | NOW"
(in Horizontal, swaps the rows).
Merge Both Tables Into One ....... see 11.4.
Merged NOW Column Side
Left / Top ......... one combined NOW column first.
Right / Bottom ..... one combined NOW column last.
Split .............. each ladder gets its own NOW column next to its
TARGET column (M/L on the left/top, S/T on the
right/bottom).
Merged Table Title / Orientation / Position / Text Size.
11.2 MID/LONG-TERM TABLE (group: M I D / L O N G - T E R M T A B L E)
-----------------------------------------------------------------------------
Rows: Mid-Term (M), Long-Term (L), Current-Year Open (Y) and Previous-Year
Open (PY, each following its own show toggle). Mid/Long rows are included
even if their chart lines are hidden.
Show Table, Table Title, Title Background, Now Column Background,
Orientation (Vertical/Horizontal), Position, Text Size,
Nearest / Next / Remaining Opacity % (100 / 50 / 20),
Reached Lookback (Months) - ✓ Column (6),
✓ Column Marker Color,
Now Column Marker Color (▲ Below Midpoint) / (▼ Above Midpoint),
Header Background (also the flat background of the ✓ column).
11.3 SHORT-TERM TABLE (group: S H O R T - T E R M - T A B L E)
-----------------------------------------------------------------------------
Same settings as 11.2, plus:
Include toggles (all ON by default):
Set 1 Entry Events (E1), Set 1 Targets (T1),
Set 2 Entry Events (E2), Set 2 Targets (T2),
Reference Levels (R1-R10).
Turning a group OFF removes its rows from the table AND from the opacity
ranking pool of the chart lines - it does NOT hide the lines themselves
(use each group's own Plot toggle for that).
Automatic open rows (table only, no chart line):
Show 1D Open + Color ... current daily candle's open.
Show 1W Open + Color ... current weekly candle's open.
Show 4H Open + Color ... current 4H candle's open.
11.4 MERGED TABLE
-----------------------------------------------------------------------------
When "Merge Both Tables Into One" is ON, the two separate tables are
replaced by one table:
NOW | M/L ✓ | M/L TARGET | S/T TARGET | S/T ✓ (Left / Top)
M/L ✓ | M/L TARGET | S/T TARGET | S/T ✓ | NOW (Right / Bottom)
M/L ✓ | M/L NOW | M/L TARGET | S/T TARGET | S/T NOW | S/T ✓ (Split)
The two ladders are vertically offset so both NOW markers land on the SAME
row. The combined NOW cell shows:
M/L ➕/➖ distance
⨀ current price
S/T ➕/➖ distance
A ladder whose own "Show Table" is OFF is left out. The merged table uses
the Mid/Long-Term title/NOW backgrounds; each ladder keeps its own header
color and opacity settings.
11.5 READING THE NOW COLUMN
-----------------------------------------------------------------------------
The indicator finds the nearest level ABOVE price and the nearest level
BELOW price and takes the midpoint between them.
- Price at or BELOW the midpoint -> marker on the BELOW level's row:
↱
CURRENT price➕$distance⁝ (dollars price is above that level)
- Price ABOVE the midpoint -> marker on the ABOVE level's row:
➖$distance⁝ (dollars price is still below that level)
↳
CURRENT priceIn short: the marker sits on whichever bracketing level price is closer
to. If price is beyond every level on one side (no bracketing pair), the
NOW column is blank and the title shows "Price Off Limits".
================================================================================
12. ROW SUFFIX LEGEND
================================================================================
M ..... Mid-Term target E1 .... Set 1 Entry
L ..... Long-Term target E2 .... Set 2 Entry
Y ..... Current-Year Open T1 .... Set 1 Target
PY .... Previous-Year Open T2 .... Set 2 Target
1D .... Daily open R1-R10 Reference Levels I - X
1W .... Weekly open 4H .... 4-hour open
Chart caption prefixes: MT (Mid-Term), LT (Long-Term), ⨀Y, ⨀PY,
EARLY n / EVENT n (entries), 🎯+n% (targets).
================================================================================
13. PERFORMANCE TIPS
================================================================================
- The heaviest per-tick work is the ↤Candle / Pivot start-bar search of
Reference Levels, which scans back up to "Start N days in the past"
worth of bars per level. On low timeframes (1m-5m) with many levels:
* lower "Start N days in the past", or
* switch busy levels to "Fixed" mode.
- Unused levels (price 0.0) cost nothing.
- Keep "Gradient Smoothness" modest when shading several gaps.
- The 4H and 1D open rows only request data when their toggles are ON.
================================================================================
14. TROUBLESHOOTING / FAQ
================================================================================
Q: The tables show, but no lines appear.
A: Chart levels only draw on live realtime ticks. Wait for the next tick
or check that the market is open / data is streaming.
Q: Set 1 levels are missing.
A: The zigzag needs at least three pivots. Try a smaller ZigZag Period or
load more history. Also check "PLOT [4H SHORTER GRADE]" is ON.
Q: Set 2 prices don't show.
A: Use commas with no spaces, numbers only (no $ or thousands separators).
Q: The Yearly Open lines disappeared.
A: They also require the "Long Term" show toggle to be ON.
Q: A Reference Level line starts too far left / right.
A: Change its Line Start Mode (Fixed / Pivot / ↤Candle), or adjust
"Start N days in the past", "Pivot Lookback" or "Pivot Price Tolerance".
Q: Some lines or shades vanish when many features are on.
A: The 500-line limit was reached. Reduce shading bands, shaded gaps, or
the number of ratios/multipliers.
Q: Why does a hidden group still affect opacity?
A: Chart visibility and table inclusion are separate. Ranking follows the
Short-Term table include toggles, not the Plot toggles.
Q: Long-Term rungs look wrong for my symbol.
A: The range defaults are BTC prices. Enter the Low/High of your own
symbol's macro ranges, or enable "Use Weekly ATH For All Ranges".
================================================================================
End of manual
================================================================================
版本注释
Updated with round pixel dials.版本注释
I added a new 🪙 B U Y / S E L L - S I G N A L S block right after the Entry/Target Events section and a short note in the overview. Everything else in the script is unchanged. I can't compile Pine here, so please paste it into TradingView and send me any compiler error.How the signals work
Direction follows where the Set 1 targets project. If the 125/160/200% targets sit above the 0% anchor, signals are BUYs; if below, SELLs. This works with Invert on or off.
Trigger: a candle closes through an entry level in that direction. Each level fires once per confirmed leg. If one candle crosses several levels, only the deepest one gets a label.
EARLY 1 and EARLY 2 (40% and 50%) are marked as risky. The tooltip says the level is shallow and the move isn't confirmed yet, and these labels are drawn more transparent.
EVENT 1 and EVENT 2 (60% and 100%) are marked as safer. The tooltip says price pushed through a deeper level, so the move has more confirmation.
Tooltip contents
Entry is the signal candle's close, with the level price shown next to it.
SL sits behind the crossed level by SL Distance (25% of the leg length by default).
TP is the selected target (125% by default). If the candle already closed past it, the next target out is used.
Risk:Reward is shown as 1 : X.
Signal Strength % adds up four parts, capped at 100: a tier base (30, 40, 55 or 65), up to 15 for candle body in the trade direction, up to 10 for volume above its 20-bar average, and up to 10 for R:R. The tooltip shows the breakdown. Early signals top out lower than entry signals.
Settings and history
Non-Repainting (on by default) tests the close against the levels from the previous bar's close. A pivot forming on the live candle can't move them.
Candle-Close Confirmation (on by default) prints labels only once the candle closes.
With both on, live signals match historical ones exactly.
History Sets To Keep = 2. A "set" is every signal from one confirmed leg, so you see the current leg's labels plus the previous leg's. Older ones are deleted. If you meant "last 2 BUY and last 2 SELL labels" instead, tell me and I'll switch it.
Signal Types can show Early + Entry, Entry only, or Early only.
Alerts: BUY and SELL alert conditions are added, plus a dynamic alert that carries the full tooltip text.
版本注释
The signal block now follows the gauge, so there are no SELL signals at or inside 100%. The rest of the script is untouched. I can't compile Pine here, so send me any compiler error if one comes up.Gauge
level Label Color
40% BUY ⚠ EARLY ENTRY #1, risky Orange
50% BUY ⚠ EARLY ENTRY #2, risky Orange
60% BUY ✔ ENTRY EVENT #1, safer Green
100% BUY ✔ ENTRY EVENT #2, safer Green
125%/
160%/
200% SELL 🎯 TP1 / TP2 / TP3 Red
Placement: each label now sits on the candle whose wick first reached that level after the leg's 0% pivot. BUY labels go under the candle and SELL labels over it. Each level fires once per leg. If one candle reaches several levels, it gets one label for the deepest BUY level and one for the deepest SELL level.
BUY tooltips show:
The risky or safer note.
Entry at the level price.
The SL.
TP1, TP2 and TP3 at the 125/160/200% target lines, each with its own R:R.
Signal Strength %, with its breakdown.
SELL tooltips show:
The exit price.
The gain and R:R from each of the four entries.
The next target.
Signal Strength %.
Non-Repainting works differently now:
ON (default): the zigzag confirms a leg late, so levels price touched before the leg confirmed are skipped. No label is ever drawn into the past.
OFF: those levels are added onto the exact candles that touched them as soon as the leg confirms. Turn it off if you want every touch labeled on its candle, knowing those labels appear after the fact.
Removed inputs: the old BUY/SELL colors and Early Transparency are replaced by Early Entry / Entry Event / SELL colors. There's also a toggle for the target SELL signals.
版本注释
Bugs fixed.版本注释
New features added.
免责声明
这些信息和出版物并非旨在提供,也不构成TradingView提供或认可的任何形式的财务、投资、交易或其他类型的建议或推荐。请阅读使用条款了解更多信息。
免责声明
这些信息和出版物并非旨在提供,也不构成TradingView提供或认可的任何形式的财务、投资、交易或其他类型的建议或推荐。请阅读使用条款了解更多信息。