OPEN-SOURCE SCRIPT
已更新 Adaptive Stochastic Calibrated, Regime-Aware & Embedded-Trend
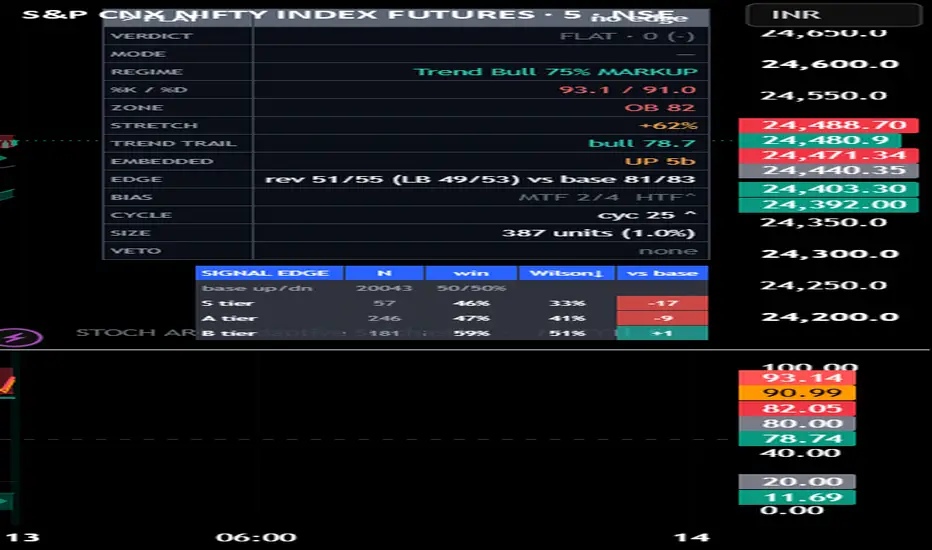
# STOCH ARC — TradingView Publication Description
> Copy the section between the lines into TradingView's "Description" box when you
> publish. It is written to satisfy the house-rules that caused the previous
> rejection: it states **why** the components are combined and **how they work
> together**, explains **what it does / how / how to use / why it is original**,
> and ends with the required disclaimer. A publishing checklist (clean chart +
> visible symbol/timeframe/name) is at the very bottom — that part is for YOU, do
> not paste it.
---
## Adaptive Stochastic — Calibrated, Regime-Aware & Embedded-Trend (STOCH ARC)
### What it is
A Stochastic oscillator rebuilt so that "overbought/oversold" means something for
the instrument you are actually trading, and so that it stops fading trends. A
classic Stochastic has two well-known failures: the 80/20 levels are arbitrary for
any given symbol, and in a real trend the oscillator **embeds** (pins at an
extreme) and keeps going — so mechanically fading every extreme walks straight
into the move. STOCH ARC addresses both, then wraps a regime filter, a
trend-trail, multi-timeframe agreement and a transparent conviction score around
the result so one panel answers a single question: **fade this extreme, ride the
trend, or stand aside.**
It runs on **any symbol, asset class, timeframe and market** — equities, indices,
futures, FX, crypto, commodities. The raw data source and every external feed are
user-selectable (details under *Settings*), and nothing is hard-coded to a
particular market.
### Why these components are combined (mashup rationale)
This is not a pile of indicators stacked for show. A raw Stochastic only tells you
"price sits high or low inside its recent range" — which is ambiguous between a
range (fade it) and a trend (it embeds and continues). Each layer removes one
specific weakness of the layer before it and feeds the next:
1. **Calibrated OB/OS** — instead of fixed 80/20, the overbought/oversold lines are
rolling percentiles of the oscillator's *own* recent distribution. "Extreme" now
means statistically rare **for this symbol on this timeframe**, which is what
makes the levels portable across markets.
2. **Embedded-trend detector** — counts how long the oscillator stays beyond a
calibrated band. A pinned oscillator is the signature of a trend, not a
reversal, so when it is embedded the fade signals are suppressed. This is the
piece that stops the classic "fade into a trend" mistake.
3. **Low-lag digital smoothing + optional Inverse Fisher Transform** — de-noise the
%K/%D so the calibration and the crosses react to real turns rather than tick
noise. (The Inverse Fisher option is off by default because it deliberately
saturates the oscillator, which flattens the calibrated percentiles.)
4. **Regime engine** — an efficiency-ratio / trend-strength / volatility-cluster
classifier labels the market Trend / Range / Volatile and decides *which* of the
two playbooks is live: fade extremes in a range, ride pullbacks in a trend.
5. **Adaptive Trend Trail** — an adaptive moving average wrapped in a
volatility-scaled trailing band, computed **on the oscillator**. It supplies the
oscillator's own trend direction and the continuation (ride) trigger, and its
band width auto-scales with oscillator volatility so it behaves consistently
across assets.
6. **Multi-timeframe agreement + conviction score with hard vetoes** — higher
timeframes must not contradict the signal, and a weighted score (stretch,
embedment, trend-trail alignment, MTF, optional feeds) is gated by hard vetoes
(e.g. a volatility-index spike or an opposing higher timeframe). The output is a
single verdict instead of a wall of separate readings.
Each block consumes the output of the previous one; remove any single layer and a
specific, nameable failure of the plain Stochastic comes back. That is the
justification for combining them.
### What it plots
- **Lower pane:** the smoothed %K / %D, the calibrated overbought/oversold bands
(shaded), the adaptive trend-trail line, a midline and faint 80/20 references,
embedded-zone shading, and signal/divergence markers on the oscillator.
- **On the price chart:** "context bands" — the oscillator's range projected back
onto price (rolling high/low are %K 100/0, and the calibrated OB/OS levels mapped
to price via `low + level% × range`), so you can see at a glance how stretched
price is. Fade/continuation markers, divergence lines, and a compact dashboard
with the live numbers (%K/%D, calibrated zone, stretch, trend-trail, embedded
state, empirical reversal stats, MTF bias, dominant cycle, suggested size and any
active veto) round it out.
### How it is original
- The overbought/oversold thresholds are **self-calibrating percentiles of the
symbol's own oscillator distribution**, not fixed 80/20.
- It **explicitly detects embedment** and flips from fading to riding, instead of
fading every extreme.
- It carries an **empirical reversal-probability tracker** that reports, from this
symbol's own history, how often a calibrated extreme actually reversed — so the
zones are accountable rather than assumed.
- The whole thing resolves to **one regime-aware verdict with hard vetoes**, rather
than leaving you to reconcile several separate sub-indicators by eye.
### How to use it
1. Add it to any chart and timeframe. Read the **VERDICT / MODE** rows on the
dashboard first.
2. In a **Range** regime, the engine looks to **fade** calibrated extremes
(oscillator beyond the OB/OS band while not embedded), confirmed by a %K/%D cross
and/or divergence.
3. In a **Trend** regime, it looks to **ride** — a trend-trail cross or a shallow
pullback in the trend direction; fades are suppressed while the oscillator is
embedded.
4. Treat the conviction score and any active **VETO** as a filter: low conviction or
an active veto means stand aside. The suggested size is an ATR-based reference for
journaling, not an order.
5. Use the alerts (fade/ride, %K/%D cross, trend-trail cross, divergence) to be
notified instead of watching.
### Settings (use on any asset / market)
- **Raw data source** — `close`, `hl2`, `hlc3`, `ohlc4`, or point it at **another
indicator's plot**. This is what makes the script work on any instrument or as a
smoother/filter on top of your own series.
- **Stochastic source** — Price (classic Stochastic) or RSI (StochRSI).
- **Smoother** — Low-lag / 2-pole / SMA, with an optional roofing pre-filter and an
optional Inverse Fisher Transform.
- **Calibration** — overbought/oversold percentiles and the lookback used to learn
the symbol's distribution.
- **Regime / trend-trail / conviction weights** — all exposed if you want to tune.
- **Optional feeds (blank = off):** a *volatility-index symbol* (for a spike veto)
and a *cross-asset symbol* (for confluence). Both are blank by default so the
script is fully self-contained on any market; fill them only if you want them.
### Notes
- It is a **study / indicator**, not a strategy, and it places no orders.
- Signals are evaluated on bar close by default to avoid intrabar repainting of the
alerts; higher-timeframe reads use confirmed values.
---
### Disclaimer
This script is provided for educational and informational purposes only. It is a
technical-analysis study, not financial, investment, or trading advice, and not a
recommendation or solicitation to buy or sell any instrument. No indicator can
predict markets; past behaviour and any historical statistics shown do not
guarantee future results. Trading involves substantial risk of loss. You are
solely responsible for your own decisions — do your own research and consider
consulting a licensed financial professional before trading. The author accepts no
liability for any loss arising from use of this script.
版本注释
This update makes the conviction prove itself, fixes two real defects from a full code review, ships lighter, and makes the visuals read the trend at a glance.• Signal-edge table (new). Every resolved LONG/SHORT trigger is scored forward over a horizon and bucketed by the conviction tier it carried (S/A/B), showing win-rate, a 95% Wilson lower bound and the matched base rate. It answers, live on your symbol and timeframe, what the 0–100 conviction always claimed but never showed: do higher-conviction signals actually win more often? Non-repainting — each signal is scored only after its horizon fully elapses on closed bars.
• Evidence-weighted conviction (optional, default OFF). When enabled, the acted conviction is scaled by how reliably its tier has actually performed here — tiers beating their base rate keep or boost, tiers below it are discounted — bounded to 0.6–1.2× and only once a tier has enough resolved signals. The table always buckets by the CLASSIC tier, so the edge measurement can never feed on itself. (Honest note: in this mode the acted conviction also decides which signals clear the "act" threshold, so the counted population is the evidence-filtered one; it still uses no future data and does not repaint. Default off keeps the original behaviour exactly.)
• Reversion edge — now correct AND honest. Two things were fixed: (1) the OB/OS reversion rate was computed with integer division, so it collapsed to 0% or 100% — it now shows a true fractional rate; and (2) the 95% Wilson lower bound the notes promised is now actually rendered beside it, next to the matched base rate (how often any bar reverts to the midline over the same window), so a reversion rate is judged against chance with small samples punished, not shown in a vacuum.
• Robustness. The calibration window is now capped to the history buffer, so it can no longer be set past max_bars_back and throw a runtime "historical offset" error on symbols with enough bars.
• Leaner & faster (no behaviour change on any setting). A dead calibrated-percentile-SMA chain was deleted; the composite-Stochastic mode's two extra rolling-hi/lo scans and the Inverse-Fisher exponentials now compute only when their (default-OFF) feature is enabled; and two rolling built-ins in the reversion counter were hoisted so nothing sits in a conditional that would warn or desync. Output is identical; the engine just does less work per bar.
• Trend-readable visuals. The embedded-zone shading now reads as the TREND it marks — an embedded uptrend tints teal (bullish), an embedded downtrend tints red (was the reverse). Signal-marker opacity now scales with conviction, so a strong (S-tier) signal visibly stands out from a weak one. And an optional %K-vs-midline momentum fill (default OFF) gives a continuous at-a-glance momentum read. The dashboard action now reads LONG/SHORT (was BUY/SELL) to stay unambiguously a study, not advice.
Non-repaint discipline, the regime / embedded-trend / adaptive-trail engines and every signal rule are otherwise unchanged; the calibration reads a bar late, so there is no same-bar feedback. No default number was changed.
This is a study for analysis and education. It is not financial advice, not a signal service, and not a trading system.
开源脚本
秉承TradingView的精神,该脚本的作者将其开源,以便交易者可以查看和验证其功能。向作者致敬!您可以免费使用该脚本,但请记住,重新发布代码须遵守我们的网站规则。

免责声明
这些信息和出版物并非旨在提供,也不构成TradingView提供或认可的任何形式的财务、投资、交易或其他类型的建议或推荐。请阅读使用条款了解更多信息。
开源脚本
秉承TradingView的精神,该脚本的作者将其开源,以便交易者可以查看和验证其功能。向作者致敬!您可以免费使用该脚本,但请记住,重新发布代码须遵守我们的网站规则。
免责声明
这些信息和出版物并非旨在提供,也不构成TradingView提供或认可的任何形式的财务、投资、交易或其他类型的建议或推荐。请阅读使用条款了解更多信息。