US Presidents 1920–2024
Description:
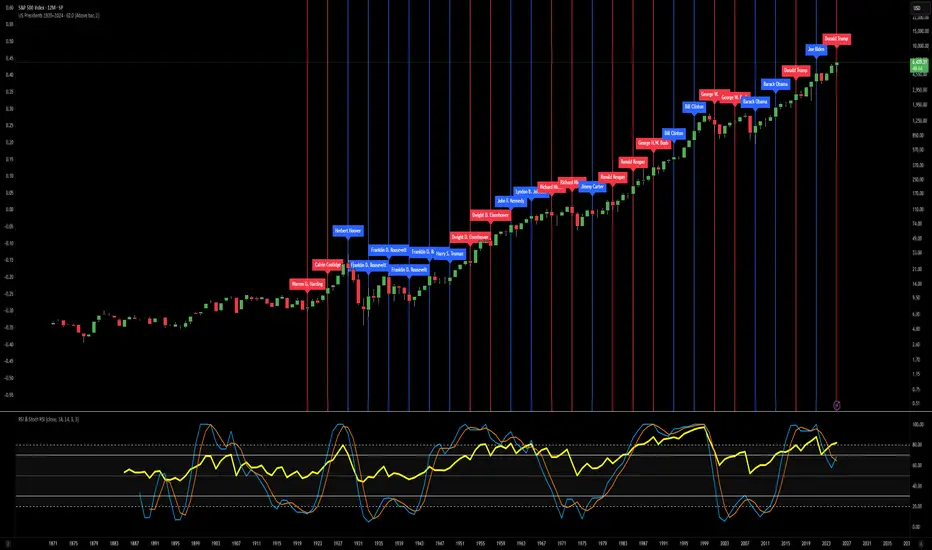
This indicator displays all U.S. presidential elections from 1920 to 2024 on your chart.
Features:
Vertical lines at the date of each presidential election.
Line color by party:
Red = Republican
Blue = Democrat
Gray = Other/None
Labels showing the name of each president.
Modern flag style: Presidents from 1900 onward are highlighted as modern, giving clear historical separation.
Fully overlayed on the price chart for timeline context.
Customizable: Label position (above/below bar) and line width.
Use case: Useful for analyzing modern U.S. presidential cycles, market reactions to elections, or quickly referencing recent presidents directly on charts.
This indicator displays all U.S. presidential elections from 1920 to 2024 on your chart.
Features:
Vertical lines at the date of each presidential election.
Line color by party:
Red = Republican
Blue = Democrat
Gray = Other/None
Labels showing the name of each president.
Modern flag style: Presidents from 1900 onward are highlighted as modern, giving clear historical separation.
Fully overlayed on the price chart for timeline context.
Customizable: Label position (above/below bar) and line width.
Use case: Useful for analyzing modern U.S. presidential cycles, market reactions to elections, or quickly referencing recent presidents directly on charts.

免责声明
这些信息和出版物并非旨在提供,也不构成TradingView提供或认可的任何形式的财务、投资、交易或其他类型的建议或推荐。请阅读使用条款了解更多信息。
免责声明
这些信息和出版物并非旨在提供,也不构成TradingView提供或认可的任何形式的财务、投资、交易或其他类型的建议或推荐。请阅读使用条款了解更多信息。