已更新
Hurst Kalman Volume SuperTrend AI
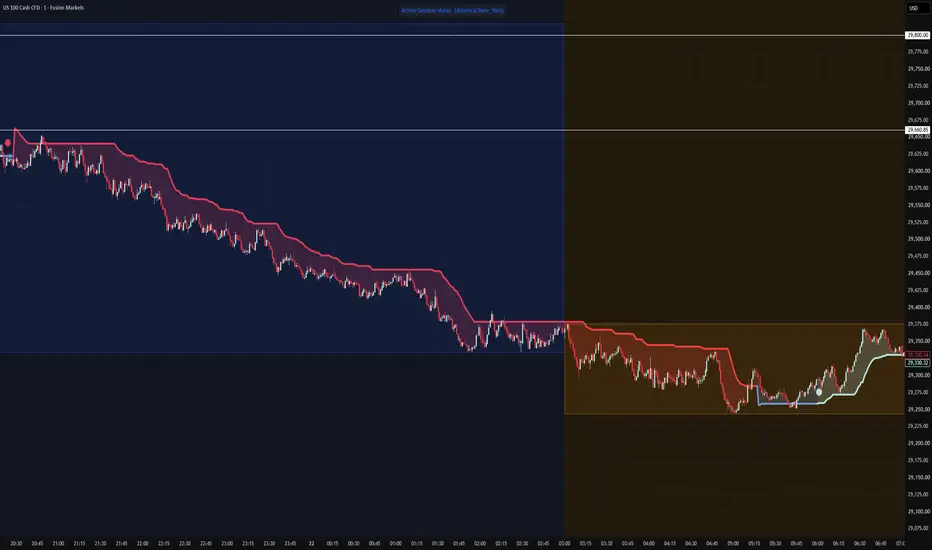
This indicator is a combination of multiple components combined into one SuperTrend indicator with artificial Intelligence.
Components include:
* Hurst Exponent
* Kalman Smoother
* Average True Range
* Volume Weighted Moving Average
* KNN Machine Learning (AI Component)
This indicator is designed to provide AI-generated signals while withstanding choppy markets and fake breakouts during consolidation, minimizing false signals and whipsaws (but not totally eliminate).
HOW TO USE:
* When you see a Green Triangle/Dot = BUY
* When you see a Red Triangle/Dot = SELL
It is best to use this indicator with a strategic framework and GREAT Risk management.
I do not claim to be the original maker of the components of this indicator. I just combined multiple components into one.
Credits go to these masters: Zeiierman, QuantAlgo
Components include:
* Hurst Exponent
* Kalman Smoother
* Average True Range
* Volume Weighted Moving Average
* KNN Machine Learning (AI Component)
This indicator is designed to provide AI-generated signals while withstanding choppy markets and fake breakouts during consolidation, minimizing false signals and whipsaws (but not totally eliminate).
HOW TO USE:
* When you see a Green Triangle/Dot = BUY
* When you see a Red Triangle/Dot = SELL
It is best to use this indicator with a strategic framework and GREAT Risk management.
I do not claim to be the original maker of the components of this indicator. I just combined multiple components into one.
Credits go to these masters: Zeiierman, QuantAlgo
版本注释
This indicator is a combination of multiple components combined into one SuperTrend indicator with artificial Intelligence.Components include:
* Hurst Exponent
* Kalman Smoother
* Average True Range
* Volume Weighted Moving Average
* KNN Machine Learning (AI Component)
This indicator is designed to provide AI-generated signals while withstanding choppy markets and fake breakouts during consolidation, minimizing false signals and whipsaws (but not totally eliminate).
HOW TO USE:
* When you see a Green Triangle/Dot = BUY
* When you see a Red Triangle/Dot = SELL
It is best to use this indicator with a strategic framework and GREAT Risk management.
I do not claim to be the original maker of the components of this indicator. I just combined multiple components into one.
Credits go to these masters: Zeiierman, LuxAlgo, QuantAlgo
版本注释
I updated the script so it will be less confusing. How to use the indicator:
When you see a Green Signal = BUY
When you see a Red Signal = SELL
When the SuperTrend goes into NEUTRAL territory (Blue line) ...
DO NOT CUT OR END THE TRADE IMMEDIATELY! Probably leave a runner and hold... (or take partials)... the indicator is designed to withstand whipsaws and consolidation and the trade may still continue the previous trend (as shown in the picture above). The tend will actually end when the indicator places an opposing signal.
Regardless, BETTER TO HAVE A MASTERFUL RISK MANAGEMENT when using this indicator.
By the way this is my last update on this script, if you want to follow my trades please check me out at:
Trade with me or copy my trades!
social.tp-redirect.com/s/6loYPBBR
Good luck to all of you!
版本注释
Removed redundant signals. It should only trigger one signal per trend.版本注释
Removed redundant entry signals.版本注释
Removed redundant entry signals.版本注释
Removed redundant entry signals.版本注释
Removed redundant entry signals.版本注释
Edited some lines out. Facebook Page: facebook.com/mftradealpha/
YouTube Page: youtube.com/@MFTradeAlpha -
Copy Trade Account: app.fusionmarkets.com/copy/strategy/123638
版本注释
Edited some lines out.Facebook Page: facebook.com/mftradealpha/
YouTube Page: youtube.com/@MFTradeAlpha -
Copy Trade Account: app.fusionmarkets.com/copy/strategy/123638

免责声明
这些信息和出版物并非旨在提供,也不构成TradingView提供或认可的任何形式的财务、投资、交易或其他类型的建议或推荐。请阅读使用条款了解更多信息。
免责声明
这些信息和出版物并非旨在提供,也不构成TradingView提供或认可的任何形式的财务、投资、交易或其他类型的建议或推荐。请阅读使用条款了解更多信息。