OPEN-SOURCE SCRIPT
Mag7 + SPY Multi-Decade Seasonality
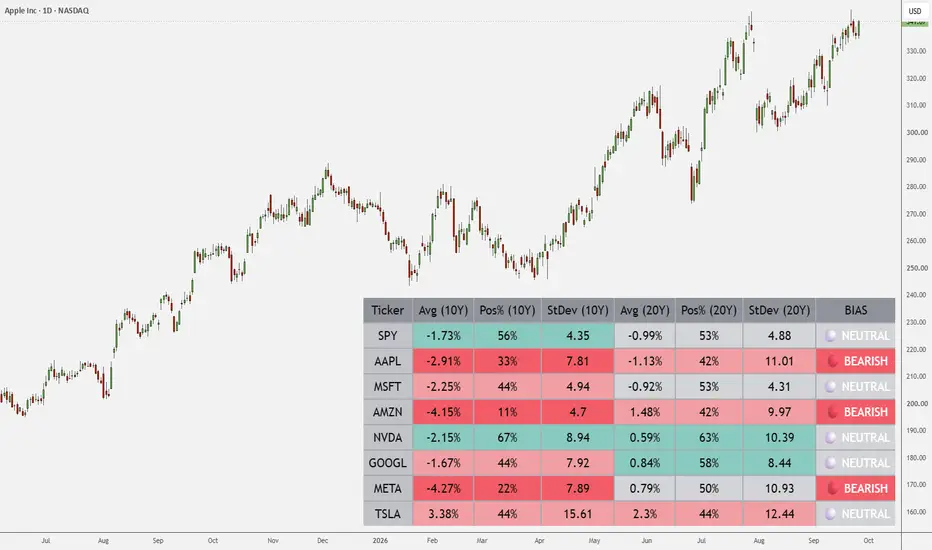
📊 Overview
The Mag7 + SPY Seasonal Dashboard tracks historical monthly seasonality across the Magnificent 7 (AAPL, MSFT, AMZN, NVDA, GOOGL, META, TSLA) and the SPY benchmark.
It dynamically pulls monthly timeframe data (1M) for the current calendar month and calculates multi-period historical metrics over 10-Year and 20-Year lookback windows.
⚙️ Key Tracked Metrics:
- Avg Return (Avg): Average historical percentage return for the current calendar month.
- Win Rate (Pos%): Percentage of historical years where the current month closed positive.
- Volatility (StDev): Standard deviation of historical monthly returns for dispersion analysis.
- Institutional BIAS:
🟢 BULLISH: Pos% (10Y) $\ge$ 70% AND Pos% (20Y) $\ge$ 60%.
🔴 BEARISH: Pos% (10Y) $\le$ 40% OR Pos% (20Y) $\le$ 40%.
⚪ NEUTRAL: Mixed or balanced historical performance.
🎯 How to Use:
- Apply the indicator overlay to any chart (the dashboard uses fixed 1M security requests, so chart timeframe won't alter the table).
- Scan the BIAS column for strong cross-period alignment between the 10-year and 20-year windows.
- Combine directional seasonal bias with technical market structure and intraday execution triggers.
The Mag7 + SPY Seasonal Dashboard tracks historical monthly seasonality across the Magnificent 7 (AAPL, MSFT, AMZN, NVDA, GOOGL, META, TSLA) and the SPY benchmark.
It dynamically pulls monthly timeframe data (1M) for the current calendar month and calculates multi-period historical metrics over 10-Year and 20-Year lookback windows.
⚙️ Key Tracked Metrics:
- Avg Return (Avg): Average historical percentage return for the current calendar month.
- Win Rate (Pos%): Percentage of historical years where the current month closed positive.
- Volatility (StDev): Standard deviation of historical monthly returns for dispersion analysis.
- Institutional BIAS:
🟢 BULLISH: Pos% (10Y) $\ge$ 70% AND Pos% (20Y) $\ge$ 60%.
🔴 BEARISH: Pos% (10Y) $\le$ 40% OR Pos% (20Y) $\le$ 40%.
⚪ NEUTRAL: Mixed or balanced historical performance.
🎯 How to Use:
- Apply the indicator overlay to any chart (the dashboard uses fixed 1M security requests, so chart timeframe won't alter the table).
- Scan the BIAS column for strong cross-period alignment between the 10-year and 20-year windows.
- Combine directional seasonal bias with technical market structure and intraday execution triggers.
开源脚本
秉承TradingView的精神,该脚本的作者将其开源,以便交易者可以查看和验证其功能。向作者致敬!您可以免费使用该脚本,但请记住,重新发布代码须遵守我们的网站规则。

免责声明
这些信息和出版物并非旨在提供,也不构成TradingView提供或认可的任何形式的财务、投资、交易或其他类型的建议或推荐。请阅读使用条款了解更多信息。
开源脚本
秉承TradingView的精神,该脚本的作者将其开源,以便交易者可以查看和验证其功能。向作者致敬!您可以免费使用该脚本,但请记住,重新发布代码须遵守我们的网站规则。
免责声明
这些信息和出版物并非旨在提供,也不构成TradingView提供或认可的任何形式的财务、投资、交易或其他类型的建议或推荐。请阅读使用条款了解更多信息。