OPEN-SOURCE SCRIPT
已更新 Chaos Weighted RSI [LuxAlgo]
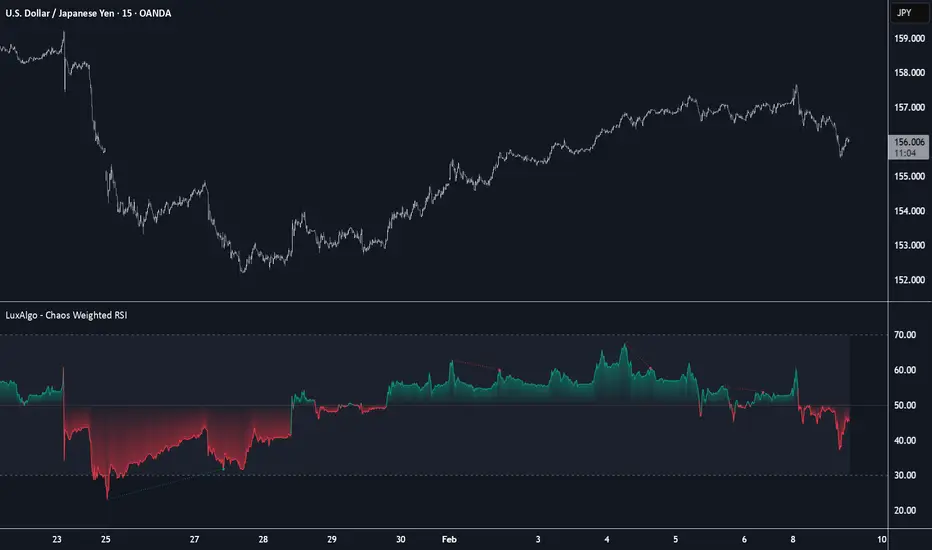
The Chaos Weighted RSI indicator provides a specialized relative strength index that adaptively adjusts its smoothing based on the level of market disorder (chaos). By utilizing Fractal Dimension Index (FDI) logic, the tool reduces sensitivity during chaotic price action to filter out market noise, offering a clearer perspective on momentum trends.
🔶 USAGE
The indicator functions similarly to a traditional RSI but with a dynamic response rate. When the market is in a state of high chaos (random, non-trending movement), the RSI smoothing becomes heavier, preventing premature overbought or oversold readings. Conversely, when the price exhibits more orderly, trending behavior, the indicator becomes more responsive.
Users can observe the following key elements:
🔶 DETAILS
The core innovation of this script is the integration of the Sevcik method for calculating Fractal Dimension. This calculation determines the "complexity" of the price path within a specific lookback window.
🔹 Weighting Mechanism
The script calculates a Chaos value (scaled 0 to 1). This value modulates the RSI's smoothing factor (alpha). High chaos reduces the alpha, resulting in a smoother, slower-reacting RSI that is less likely to be influenced by whipsaws. Low chaos increases the alpha, allowing the RSI to track the price more closely during efficient trends.
🔹 Divergence Logic
Divergences are confirmed using a pivot-based approach. Because the Chaos Weighted RSI is smoother than a standard RSI during noisy periods, the divergences detected are often more significant and less prone to minor price fluctuations.
🔶 SETTINGS
🔹 RSI Settings
🔹 Disorder Settings
🔹 Visuals
🔹 Divergence Settings
🔶 USAGE
The indicator functions similarly to a traditional RSI but with a dynamic response rate. When the market is in a state of high chaos (random, non-trending movement), the RSI smoothing becomes heavier, preventing premature overbought or oversold readings. Conversely, when the price exhibits more orderly, trending behavior, the indicator becomes more responsive.
Users can observe the following key elements:
- Trend Confirmation: The RSI line changes color based on its position relative to the 50 midline (Green for bullish momentum, Red for bearish momentum).
- Overbought/Oversold Zones: Traditional levels at 70 and 30 are used. The indicator features gradient fills to highlight when price momentum has reached these extremes.
- Divergence Detection: The script automatically identifies regular bullish and bearish divergences between price and the Chaos Weighted RSI, marking them with dots and connecting lines.
🔶 DETAILS
The core innovation of this script is the integration of the Sevcik method for calculating Fractal Dimension. This calculation determines the "complexity" of the price path within a specific lookback window.
🔹 Weighting Mechanism
The script calculates a Chaos value (scaled 0 to 1). This value modulates the RSI's smoothing factor (alpha). High chaos reduces the alpha, resulting in a smoother, slower-reacting RSI that is less likely to be influenced by whipsaws. Low chaos increases the alpha, allowing the RSI to track the price more closely during efficient trends.
🔹 Divergence Logic
Divergences are confirmed using a pivot-based approach. Because the Chaos Weighted RSI is smoother than a standard RSI during noisy periods, the divergences detected are often more significant and less prone to minor price fluctuations.
🔶 SETTINGS
🔹 RSI Settings
- RSI Length: Sets the base period for the RSI calculation.
🔹 Disorder Settings
- Disorder Lookback: The period used to calculate the price chaos via the Fractal Dimension Index.
- Weight Sensitivity: Determines how aggressively the chaos calculation affects the RSI smoothing. Higher values result in more significant smoothing during chaotic periods.
🔹 Visuals
- Overbought/Oversold Fill: Customizes the colors for the gradient fills in extreme zones.
- Background Transparency: Adjusts the visibility of the central background fill between levels 30 and 70.
🔹 Divergence Settings
- Divergence Strength: The number of bars required on the left and right of a pivot to confirm a divergence. Higher values filter for more significant, long-term signals.
- Show Bullish/Bearish Divergence: Toggles the visibility of divergence labels and lines.
版本注释
- Added color settings开源脚本
秉承TradingView的精神,该脚本的作者将其开源,以便交易者可以查看和验证其功能。向作者致敬!您可以免费使用该脚本,但请记住,重新发布代码须遵守我们的网站规则。

All content & scripts provided by LuxAlgo are for educational purposes only and are not financial advice.
免责声明
这些信息和出版物并非旨在提供,也不构成TradingView提供或认可的任何形式的财务、投资、交易或其他类型的建议或推荐。请阅读使用条款了解更多信息。
开源脚本
秉承TradingView的精神,该脚本的作者将其开源,以便交易者可以查看和验证其功能。向作者致敬!您可以免费使用该脚本,但请记住,重新发布代码须遵守我们的网站规则。
免责声明
这些信息和出版物并非旨在提供,也不构成TradingView提供或认可的任何形式的财务、投资、交易或其他类型的建议或推荐。请阅读使用条款了解更多信息。