OPEN-SOURCE SCRIPT
Timeframe Heikin Ashi RSI Oscillator
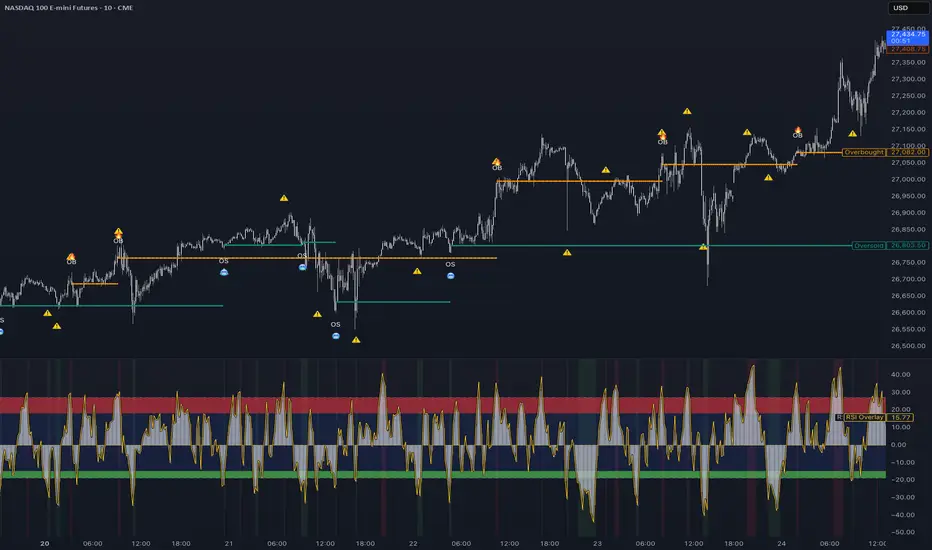
T-HARSI • Timeframe Heikin Ashi RSI Oscillator (HTF Edition)
What it is
An RSI-based oscillator that renders RSI values as Heikin Ashi candles instead of a line, with a full higher-timeframe (HTF) signal engine layered on top. The core idea — originally from JayRogers — is that translating RSI into HA-style OHLC preserves the oscillating nature of RSI while smoothing out noise and making trend/exhaustion visually obvious. The gggoaaat mods add a multi-condition overbought/oversold signal system that runs entirely on a user-selectable HTF.
How it's built
Everything is zero-median: RSI values have 50 subtracted so the oscillator swings around 0 instead of 50, with configurable OB/OS and "extreme" OB/OS bands above and below. Three core pieces generate the visuals:
The HTF signal engine
All stateful logic lives inside f_signalLogic() and is pulled through a single request.security call, so every counter, ta.barssince, and crossover naturally operates on HTF bars. The engine produces two composite signals:
A barsBetweenCalls cooldown prevents back-to-back repeats, and an htfBarEdge gate (ta.change(time(tf))) ensures plotshapes, circle-dot plots, and alerts fire exactly once per HTF bar transition rather than repeating across every chart bar that falls inside the same HTF window.
What you see on the chart
HARSI candles in the pane, OB/OS channel bands with tinted fills, optional RSI line and stoch ribbon, background shading when RSI is sustained beyond an extreme, warning triangles when the sustained-extreme threshold first trips, and 🔥OB / 🥶OS labels with orange/teal price dots on the main chart when a full composite signal fires. Alerts fire on confirmed HTF bar close for both directions.
Intended use
A mean-reversion / exhaustion tool — the signals flag spots where an HTF RSI has pushed to an extreme, held there, and then showed a reversal confirmation. Best paired with trend context on the main chart; the HARSI pane tells you when the stretch is exhausted, not which direction the trend actually is.
What it is
An RSI-based oscillator that renders RSI values as Heikin Ashi candles instead of a line, with a full higher-timeframe (HTF) signal engine layered on top. The core idea — originally from JayRogers — is that translating RSI into HA-style OHLC preserves the oscillating nature of RSI while smoothing out noise and making trend/exhaustion visually obvious. The gggoaaat mods add a multi-condition overbought/oversold signal system that runs entirely on a user-selectable HTF.
How it's built
Everything is zero-median: RSI values have 50 subtracted so the oscillator swings around 0 instead of 50, with configurable OB/OS and "extreme" OB/OS bands above and below. Three core pieces generate the visuals:
- HARSI candles — RSI is computed separately on close, high, and low, then combined into synthetic OHLC using Heikin Ashi math. Open smoothing biases toward the prior open for cleaner trend reads.
- RSI overlay line + histogram — a second RSI (independent length) plotted on top, optionally smoothed using a recursive HA-style average of current vs prior RSI.
- Stochastic RSI ribbon — stoch computed from that RSI, with K/D smoothing and a vertical scaling knob so it doesn't distort the channel.
The HTF signal engine
All stateful logic lives inside f_signalLogic() and is pulled through a single request.security call, so every counter, ta.barssince, and crossover naturally operates on HTF bars. The engine produces two composite signals:
- bullishWays (overbought / fade-long / 🔥OB label) fires when RSI has been above the extreme upper band for N consecutive HTF bars and a confirming reversal condition hits within a hold window — either a crossover-based resistance touch or a reversal-candle pattern where the HARSI close flips bearish near the extreme.
- bearishWays (oversold / fade-short / 🥶OS label) is the symmetric opposite at the lower extreme.
A barsBetweenCalls cooldown prevents back-to-back repeats, and an htfBarEdge gate (ta.change(time(tf))) ensures plotshapes, circle-dot plots, and alerts fire exactly once per HTF bar transition rather than repeating across every chart bar that falls inside the same HTF window.
What you see on the chart
HARSI candles in the pane, OB/OS channel bands with tinted fills, optional RSI line and stoch ribbon, background shading when RSI is sustained beyond an extreme, warning triangles when the sustained-extreme threshold first trips, and 🔥OB / 🥶OS labels with orange/teal price dots on the main chart when a full composite signal fires. Alerts fire on confirmed HTF bar close for both directions.
Intended use
A mean-reversion / exhaustion tool — the signals flag spots where an HTF RSI has pushed to an extreme, held there, and then showed a reversal confirmation. Best paired with trend context on the main chart; the HARSI pane tells you when the stretch is exhausted, not which direction the trend actually is.
开源脚本
秉承TradingView的精神,该脚本的作者将其开源,以便交易者可以查看和验证其功能。向作者致敬!您可以免费使用该脚本,但请记住,重新发布代码须遵守我们的网站规则。

免责声明
这些信息和出版物并非旨在提供,也不构成TradingView提供或认可的任何形式的财务、投资、交易或其他类型的建议或推荐。请阅读使用条款了解更多信息。
免责声明
这些信息和出版物并非旨在提供,也不构成TradingView提供或认可的任何形式的财务、投资、交易或其他类型的建议或推荐。请阅读使用条款了解更多信息。