Primitive Charts - Session Candles
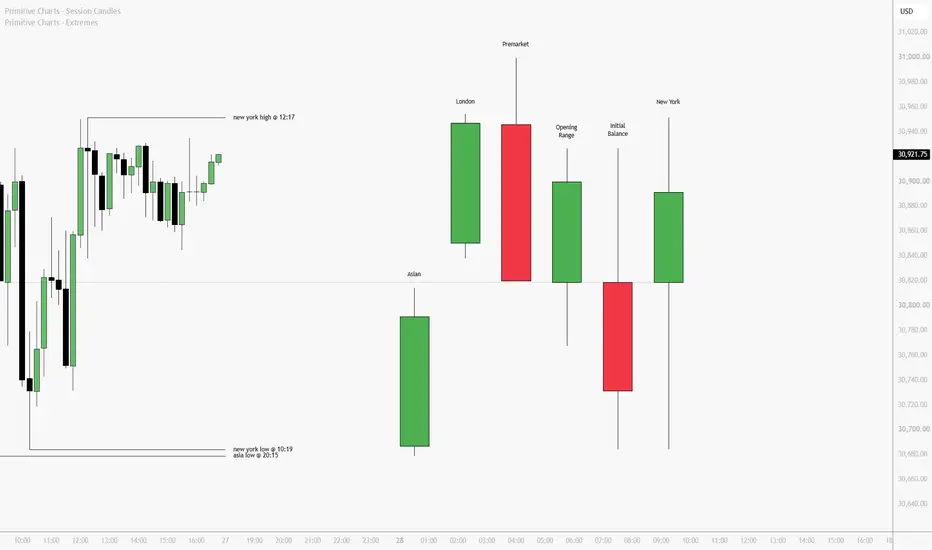
Primitive Charts - Session Candles brings the trading day's sessions into one view. Each selected time window becomes a single candle beside the chart, showing its open, high, low, and close on the instrument's price scale.
Read London's range and closing position at a glance. Compare the Opening Range with the Initial Balance. Follow New York as its candle develops. The right-side display summarizes observed prices from each session.
Each candle begins at its session's opening time, develops as price data arrives, and freezes when the session closes. The body connects the open and close; the wicks show the session's extremes. While a session is forming, the latest observed price acts as its close. White up candles and black down candles are the default.
Six session windows are included:
- Asian: 20:00–00:00
- London: 02:00–05:00
- Premarket: 05:00–09:30
- Opening Range: 09:30–10:00
- Initial Balance: 09:30–10:30
- New York: 09:30–16:00
All windows use New York time and follow daylight-saving changes, regardless of the chart's displayed timezone. Each session calculates independently, so overlapping windows such as Opening Range, Initial Balance, and New York can develop together.
Enable the sessions you want to see. Each slot has an editable name and time window, including overnight windows. You can also paste a pcr-1 roster code to load session definitions, then override the names or time windows separately.
The display keeps up to one candle per enabled session. By default, it follows the current trading day, with an 18:00 New York display reset that groups the prior evening's Asian session with the following London and New York sessions. Completed candles from the earlier trading day clear at that reset; a custom session crossing 18:00 stays visible through its own window.
“Show candles from the previous day” keeps each session's most recent available candle visible until its next occurrence begins. The new candle replaces it in the same slot.
“Trace Candle Open” connects each visible forming candle's open to the chart bar containing its session start, when its data and opening anchor are available. When no visible session is forming, the trace follows the most recently completed visible candle with complete data. This provides a reference between the session summary and the underlying chart.
Display settings include:
- Minimum and maximum chart timeframes, with 1 minute and 4 hours as the defaults.
- Distance from the chart, space between sessions, and candle width.
- Shared up/down colors for bodies, borders, and wicks.
- Optional session names, times, and dates, with text size, color, and label position controls.
Session names are shown by default; times and dates are off. Names follow each candle's own wick. Hover a visible label to inspect OHLC, session status, and source timestamps.
Use standard time-based charts from 1 minute through 4 hours, with the required session hours included. Session prices are measured from one-minute data across that range. Minimum and maximum timeframe settings control visibility. Leave enough space to the right of the chart for the candles.
Available history depends on the symbol, feed, and TradingView plan. Missing session minutes or boundaries produce an “Incomplete” label and withhold the candle. Custom windows spanning a market closure can also be marked incomplete. Source timestamps identify minute bars; open traces are omitted when their starting bar is more than 4,999 chart bars back.
Read London's range and closing position at a glance. Compare the Opening Range with the Initial Balance. Follow New York as its candle develops. The right-side display summarizes observed prices from each session.
Each candle begins at its session's opening time, develops as price data arrives, and freezes when the session closes. The body connects the open and close; the wicks show the session's extremes. While a session is forming, the latest observed price acts as its close. White up candles and black down candles are the default.
Six session windows are included:
- Asian: 20:00–00:00
- London: 02:00–05:00
- Premarket: 05:00–09:30
- Opening Range: 09:30–10:00
- Initial Balance: 09:30–10:30
- New York: 09:30–16:00
All windows use New York time and follow daylight-saving changes, regardless of the chart's displayed timezone. Each session calculates independently, so overlapping windows such as Opening Range, Initial Balance, and New York can develop together.
Enable the sessions you want to see. Each slot has an editable name and time window, including overnight windows. You can also paste a pcr-1 roster code to load session definitions, then override the names or time windows separately.
The display keeps up to one candle per enabled session. By default, it follows the current trading day, with an 18:00 New York display reset that groups the prior evening's Asian session with the following London and New York sessions. Completed candles from the earlier trading day clear at that reset; a custom session crossing 18:00 stays visible through its own window.
“Show candles from the previous day” keeps each session's most recent available candle visible until its next occurrence begins. The new candle replaces it in the same slot.
“Trace Candle Open” connects each visible forming candle's open to the chart bar containing its session start, when its data and opening anchor are available. When no visible session is forming, the trace follows the most recently completed visible candle with complete data. This provides a reference between the session summary and the underlying chart.
Display settings include:
- Minimum and maximum chart timeframes, with 1 minute and 4 hours as the defaults.
- Distance from the chart, space between sessions, and candle width.
- Shared up/down colors for bodies, borders, and wicks.
- Optional session names, times, and dates, with text size, color, and label position controls.
Session names are shown by default; times and dates are off. Names follow each candle's own wick. Hover a visible label to inspect OHLC, session status, and source timestamps.
Use standard time-based charts from 1 minute through 4 hours, with the required session hours included. Session prices are measured from one-minute data across that range. Minimum and maximum timeframe settings control visibility. Leave enough space to the right of the chart for the candles.
Available history depends on the symbol, feed, and TradingView plan. Missing session minutes or boundaries produce an “Incomplete” label and withhold the candle. Custom windows spanning a market closure can also be marked incomplete. Source timestamps identify minute bars; open traces are omitted when their starting bar is more than 4,999 chart bars back.

免责声明
这些信息和出版物并非旨在提供,也不构成TradingView提供或认可的任何形式的财务、投资、交易或其他类型的建议或推荐。请阅读使用条款了解更多信息。
免责声明
这些信息和出版物并非旨在提供,也不构成TradingView提供或认可的任何形式的财务、投资、交易或其他类型的建议或推荐。请阅读使用条款了解更多信息。