OPEN-SOURCE SCRIPT
已更新 PG Premium - Master Volatility Hub
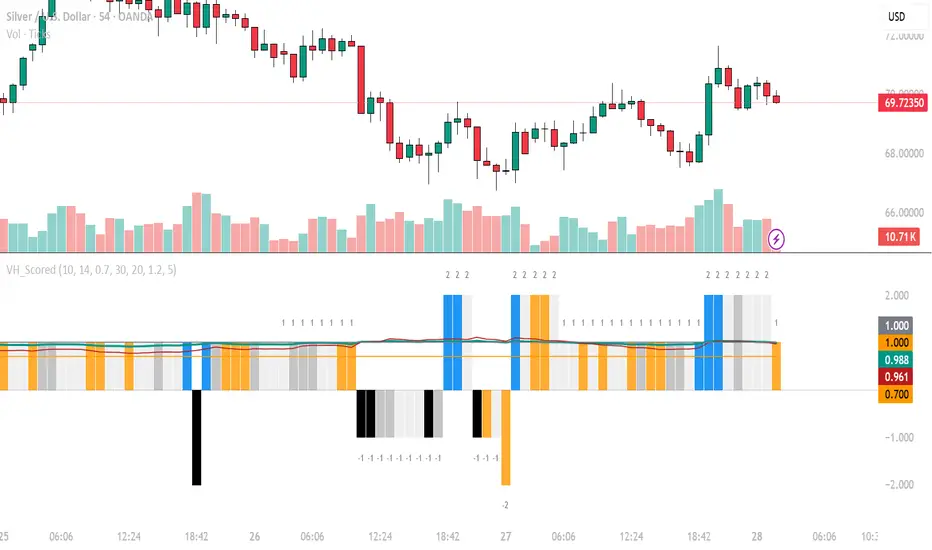
How to Interpret & Trade the Signals
1. The Volatility Squeeze (Preparation Phase)
Signal: Histogram bars turn Orange.
Meaning: The market is coiling. Range is < 70% of the average.
Action: Do not enter yet. This is the "loading" phase. Watch for which side the breakout occurs.
2. High-Conviction Bullish Breakout (Buy Signal)
Signal: A Royal Blue bar appears + Green Line (Crossover) climbs above 1.0.
Meaning: The squeeze has released to the upside with institutional volume.
Action: Potential Long entry. Place stop-loss at the low of the previous Orange squeeze zone.
3. High-Conviction Bearish Breakdown (Sell Signal)
Signal: A Pure Black bar appears + Green Line (Crossover) climbs above 1.0.
Meaning: Aggressive selling has entered the market.
Action: Potential Short entry. Place stop-loss at the high of the recent consolidation.
4. The "Hollow" Trap (Warning Signal)
Signal: Price moves significantly, but the bar is Dark Gray.
Meaning: This is a "low-fuel" move. Price is expanding, but volume is below the 1.2x threshold.
Action: Exercise caution. These moves often result in "v-shape" reversals or fake-outs.
Pro-Trading Tips
The Volatility Regime (Red Line): If the Red Line is rising above 1.0, the market is becoming generally more volatile. Expect wider swings and consider wider stop-losses. If it is below 1.0, the market is in a "quiet regime"—breakouts may be smaller.
The "Double Confirmation": The most powerful trades happen when a Blue/Black bar appears exactly as the Green Line crosses the 1.0 level from below. This confirms that both the single-bar range and the multi-bar average are expanding at the same time.
Suggested "Release Note" Summary for Users
"For best results, use this on the 1H or 4H timeframes to filter out intraday noise. This indicator does not predict direction—it identifies Conviction. Always align the Blue/Black signals with your existing trend-following strategy or key Support/Resistance levels."
1. The Volatility Squeeze (Preparation Phase)
Signal: Histogram bars turn Orange.
Meaning: The market is coiling. Range is < 70% of the average.
Action: Do not enter yet. This is the "loading" phase. Watch for which side the breakout occurs.
2. High-Conviction Bullish Breakout (Buy Signal)
Signal: A Royal Blue bar appears + Green Line (Crossover) climbs above 1.0.
Meaning: The squeeze has released to the upside with institutional volume.
Action: Potential Long entry. Place stop-loss at the low of the previous Orange squeeze zone.
3. High-Conviction Bearish Breakdown (Sell Signal)
Signal: A Pure Black bar appears + Green Line (Crossover) climbs above 1.0.
Meaning: Aggressive selling has entered the market.
Action: Potential Short entry. Place stop-loss at the high of the recent consolidation.
4. The "Hollow" Trap (Warning Signal)
Signal: Price moves significantly, but the bar is Dark Gray.
Meaning: This is a "low-fuel" move. Price is expanding, but volume is below the 1.2x threshold.
Action: Exercise caution. These moves often result in "v-shape" reversals or fake-outs.
Pro-Trading Tips
The Volatility Regime (Red Line): If the Red Line is rising above 1.0, the market is becoming generally more volatile. Expect wider swings and consider wider stop-losses. If it is below 1.0, the market is in a "quiet regime"—breakouts may be smaller.
The "Double Confirmation": The most powerful trades happen when a Blue/Black bar appears exactly as the Green Line crosses the 1.0 level from below. This confirms that both the single-bar range and the multi-bar average are expanding at the same time.
Suggested "Release Note" Summary for Users
"For best results, use this on the 1H or 4H timeframes to filter out intraday noise. This indicator does not predict direction—it identifies Conviction. Always align the Blue/Black signals with your existing trend-following strategy or key Support/Resistance levels."
版本注释
How to Interpret & Trade the Signals1. The Volatility Squeeze (Preparation Phase)
Signal: Histogram bars turn Orange.
Meaning: The market is coiling. Range is < 70% of the average.
Action: Do not enter yet. This is the "loading" phase. Watch for which side the breakout occurs.
2. High-Conviction Bullish Breakout (Buy Signal)
Signal: A Royal Blue bar appears + Green Line (Crossover) climbs above 1.0.
Meaning: The squeeze has released to the upside with institutional volume.
Action: Potential Long entry. Place stop-loss at the low of the previous Orange squeeze zone.
3. High-Conviction Bearish Breakdown (Sell Signal)
Signal: A Pure Black bar appears + Green Line (Crossover) climbs above 1.0.
Meaning: Aggressive selling has entered the market.
Action: Potential Short entry. Place stop-loss at the high of the recent consolidation.
4. The "Hollow" Trap (Warning Signal)
Signal: Price moves significantly, but the bar is Dark Gray.
Meaning: This is a "low-fuel" move. Price is expanding, but volume is below the 1.2x threshold.
Action: Exercise caution. These moves often result in "v-shape" reversals or fake-outs.
Pro-Trading Tips
The Volatility Regime (Red Line): If the Red Line is rising above 1.0, the market is becoming generally more volatile. Expect wider swings and consider wider stop-losses. If it is below 1.0, the market is in a "quiet regime"—breakouts may be smaller.
The "Double Confirmation": The most powerful trades happen when a Blue/Black bar appears exactly as the Green Line crosses the 1.0 level from below. This confirms that both the single-bar range and the multi-bar average are expanding at the same time.
Suggested "Release Note" Summary for Users
"For best results, use this on the 1H or 4H timeframes to filter out intraday noise. This indicator does not predict direction—it identifies Conviction. Always align the Blue/Black signals with your existing trend-following strategy or key Support/Resistance levels."
版本注释
How to Interpret & Trade the Signals1. The Volatility Squeeze (Preparation Phase)
Signal: Histogram bars turn Orange.
Meaning: The market is coiling. Range is < 70% of the average.
Action: Do not enter yet. This is the "loading" phase. Watch for which side the breakout occurs.
2. High-Conviction Bullish Breakout (Buy Signal)
Signal: A Royal Blue bar appears + Green Line (Crossover) climbs above 1.0.
Meaning: The squeeze has released to the upside with institutional volume.
Action: Potential Long entry. Place stop-loss at the low of the previous Orange squeeze zone.
3. High-Conviction Bearish Breakdown (Sell Signal)
Signal: A Pure Black bar appears + Green Line (Crossover) climbs above 1.0.
Meaning: Aggressive selling has entered the market.
Action: Potential Short entry. Place stop-loss at the high of the recent consolidation.
4. The "Hollow" Trap (Warning Signal)
Signal: Price moves significantly, but the bar is Dark Gray.
Meaning: This is a "low-fuel" move. Price is expanding, but volume is below the 1.2x threshold.
Action: Exercise caution. These moves often result in "v-shape" reversals or fake-outs.
Pro-Trading Tips
The Volatility Regime (Red Line): If the Red Line is rising above 1.0, the market is becoming generally more volatile. Expect wider swings and consider wider stop-losses. If it is below 1.0, the market is in a "quiet regime"—breakouts may be smaller.
The "Double Confirmation": The most powerful trades happen when a Blue/Black bar appears exactly as the Green Line crosses the 1.0 level from below. This confirms that both the single-bar range and the multi-bar average are expanding at the same time.
Suggested "Release Note" Summary for Users
"For best results, use this on the 1H or 4H timeframes to filter out intraday noise. This indicator does not predict direction—it identifies Conviction. Always align the Blue/Black signals with your existing trend-following strategy or key Support/Resistance levels."
版本注释
How to Interpret & Trade the Signals1. The Volatility Squeeze (Preparation Phase)
Signal: Histogram bars turn Orange.
Meaning: The market is coiling. Range is < 70% of the average.
Action: Do not enter yet. This is the "loading" phase. Watch for which side the breakout occurs.
2. High-Conviction Bullish Breakout (Buy Signal)
Signal: A Royal Blue bar appears + Green Line (Crossover) climbs above 1.0.
Meaning: The squeeze has released to the upside with institutional volume.
Action: Potential Long entry. Place stop-loss at the low of the previous Orange squeeze zone.
3. High-Conviction Bearish Breakdown (Sell Signal)
Signal: A Pure Black bar appears + Green Line (Crossover) climbs above 1.0.
Meaning: Aggressive selling has entered the market.
Action: Potential Short entry. Place stop-loss at the high of the recent consolidation.
4. The "Hollow" Trap (Warning Signal)
Signal: Price moves significantly, but the bar is Dark Gray.
Meaning: This is a "low-fuel" move. Price is expanding, but volume is below the 1.2x threshold.
Action: Exercise caution. These moves often result in "v-shape" reversals or fake-outs.
Pro-Trading Tips
The Volatility Regime (Red Line): If the Red Line is rising above 1.0, the market is becoming generally more volatile. Expect wider swings and consider wider stop-losses. If it is below 1.0, the market is in a "quiet regime"—breakouts may be smaller.
The "Double Confirmation": The most powerful trades happen when a Blue/Black bar appears exactly as the Green Line crosses the 1.0 level from below. This confirms that both the single-bar range and the multi-bar average are expanding at the same time.
Suggested "Release Note" Summary for Users
"For best results, use this on the 1H or 4H timeframes to filter out intraday noise. This indicator does not predict direction—it identifies Conviction. Always align the Blue/Black signals with your existing trend-following strategy or key Support/Resistance levels."
版本注释
How to Interpret & Trade the Signals1. The Volatility Squeeze (Preparation Phase)
Signal: Histogram bars turn Orange.
Meaning: The market is coiling. Range is < 70% of the average.
Action: Do not enter yet. This is the "loading" phase. Watch for which side the breakout occurs.
2. High-Conviction Bullish Breakout (Buy Signal)
Signal: A Royal Blue bar appears + Green Line (Crossover) climbs above 1.0.
Meaning: The squeeze has released to the upside with institutional volume.
Action: Potential Long entry. Place stop-loss at the low of the previous Orange squeeze zone.
3. High-Conviction Bearish Breakdown (Sell Signal)
Signal: A Pure Black bar appears + Green Line (Crossover) climbs above 1.0.
Meaning: Aggressive selling has entered the market.
Action: Potential Short entry. Place stop-loss at the high of the recent consolidation.
4. The "Hollow" Trap (Warning Signal)
Signal: Price moves significantly, but the bar is Dark Gray.
Meaning: This is a "low-fuel" move. Price is expanding, but volume is below the 1.2x threshold.
Action: Exercise caution. These moves often result in "v-shape" reversals or fake-outs.
Pro-Trading Tips
The Volatility Regime (Red Line): If the Red Line is rising above 1.0, the market is becoming generally more volatile. Expect wider swings and consider wider stop-losses. If it is below 1.0, the market is in a "quiet regime"—breakouts may be smaller.
The "Double Confirmation": The most powerful trades happen when a Blue/Black bar appears exactly as the Green Line crosses the 1.0 level from below. This confirms that both the single-bar range and the multi-bar average are expanding at the same time.
Suggested "Release Note" Summary for Users
"For best results, use this on the 1H or 4H timeframes to filter out intraday noise. This indicator does not predict direction—it identifies Conviction. Always align the Blue/Black signals with your existing trend-following strategy or key Support/Resistance levels."
开源脚本
秉承TradingView的精神,该脚本的作者将其开源,以便交易者可以查看和验证其功能。向作者致敬!您可以免费使用该脚本,但请记住,重新发布代码须遵守我们的网站规则。

Follow @i2gain on X.COM
免责声明
这些信息和出版物并非旨在提供,也不构成TradingView提供或认可的任何形式的财务、投资、交易或其他类型的建议或推荐。请阅读使用条款了解更多信息。
开源脚本
秉承TradingView的精神,该脚本的作者将其开源,以便交易者可以查看和验证其功能。向作者致敬!您可以免费使用该脚本,但请记住,重新发布代码须遵守我们的网站规则。
Follow @i2gain on X.COM
免责声明
这些信息和出版物并非旨在提供,也不构成TradingView提供或认可的任何形式的财务、投资、交易或其他类型的建议或推荐。请阅读使用条款了解更多信息。