OPEN-SOURCE SCRIPT
Extreme HMA ATR Bands
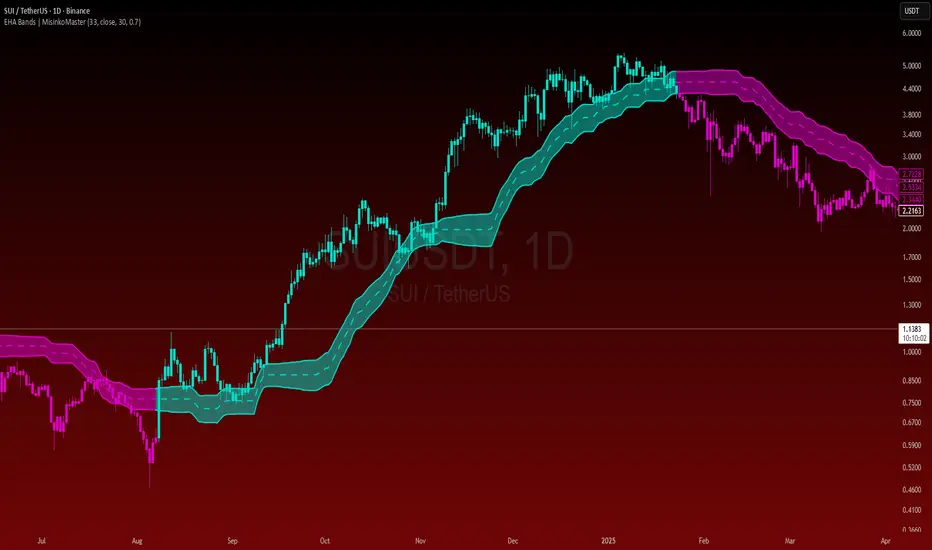
Extreme HMA ATR Bands
Extreme HMA ATR Bands are a fast and smooth trend-following tool designed to capture directional moves while minimizing false signals across volatile markets.
🚀 Benefits
• High responsiveness to market moves
• Smooth trend tracking with fewer false signals
• Strong performance on assets such as SOLUSD, SUIUSD, and CROUSD
• Clear visual band structure for easier market interpretation
💡 Core Idea
The indicator builds adaptive bands around a smoothed price structure derived from Hull-type processing. By focusing on extreme values and combining them into a balanced midpoint, the bands capture trend direction while maintaining smooth behavior.
ATR is then applied to dynamically scale the bands according to market volatility.
⚙️ How It Works
A fast-smoothed price series is calculated using Hull-style logic.
Highest and lowest values of this series are measured over multiple stages.
These extremes are processed again to balance responsiveness and smoothness.
The resulting midpoint forms the base trend line.
ATR is added and subtracted from this midpoint to generate adaptive upper and lower bands.
The result is a fast yet stable band structure that reacts efficiently to market direction changes.
📌 Usage Notes
• Price moving above the upper band suggests bullish pressure.
• Price moving below the lower band suggests bearish pressure.
• Band expansion signals increasing volatility.
• Band contraction often indicates consolidation phases.
Enjoy and trade smart.
Extreme HMA ATR Bands are a fast and smooth trend-following tool designed to capture directional moves while minimizing false signals across volatile markets.
🚀 Benefits
• High responsiveness to market moves
• Smooth trend tracking with fewer false signals
• Strong performance on assets such as SOLUSD, SUIUSD, and CROUSD
• Clear visual band structure for easier market interpretation
💡 Core Idea
The indicator builds adaptive bands around a smoothed price structure derived from Hull-type processing. By focusing on extreme values and combining them into a balanced midpoint, the bands capture trend direction while maintaining smooth behavior.
ATR is then applied to dynamically scale the bands according to market volatility.
⚙️ How It Works
A fast-smoothed price series is calculated using Hull-style logic.
Highest and lowest values of this series are measured over multiple stages.
These extremes are processed again to balance responsiveness and smoothness.
The resulting midpoint forms the base trend line.
ATR is added and subtracted from this midpoint to generate adaptive upper and lower bands.
The result is a fast yet stable band structure that reacts efficiently to market direction changes.
📌 Usage Notes
• Price moving above the upper band suggests bullish pressure.
• Price moving below the lower band suggests bearish pressure.
• Band expansion signals increasing volatility.
• Band contraction often indicates consolidation phases.
Enjoy and trade smart.
开源脚本
秉承TradingView的精神,该脚本的作者将其开源,以便交易者可以查看和验证其功能。向作者致敬!您可以免费使用该脚本,但请记住,重新发布代码须遵守我们的网站规则。

"Better to take a step back, than to stand stuck forever."
免责声明
这些信息和出版物并非旨在提供,也不构成TradingView提供或认可的任何形式的财务、投资、交易或其他类型的建议或推荐。请阅读使用条款了解更多信息。
开源脚本
秉承TradingView的精神,该脚本的作者将其开源,以便交易者可以查看和验证其功能。向作者致敬!您可以免费使用该脚本,但请记住,重新发布代码须遵守我们的网站规则。
"Better to take a step back, than to stand stuck forever."
免责声明
这些信息和出版物并非旨在提供,也不构成TradingView提供或认可的任何形式的财务、投资、交易或其他类型的建议或推荐。请阅读使用条款了解更多信息。