OPEN-SOURCE SCRIPT
Multi-Timeframe SMA Wave
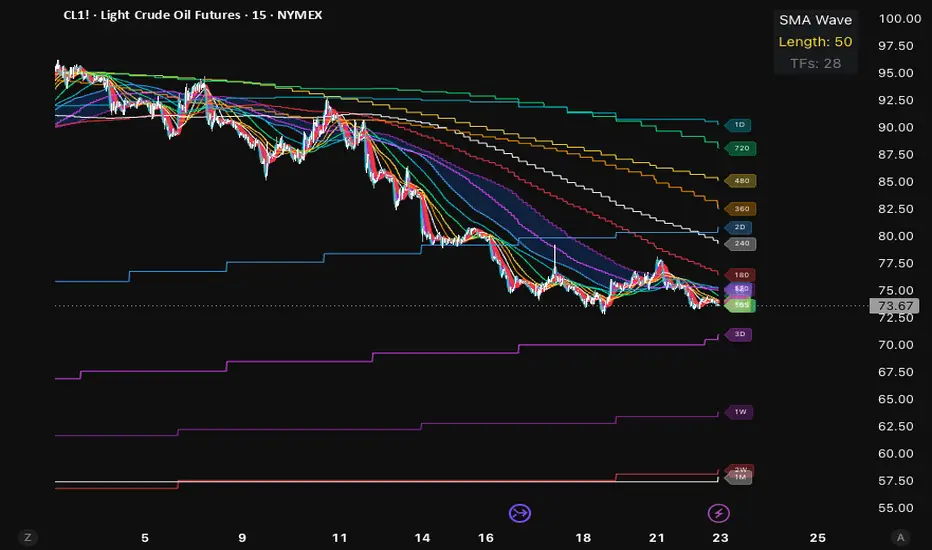
This is a powerful multi-timeframe Simple Moving Average (SMA) visualizer that plots up to 28 different timeframes of the same SMA length simultaneously on your current chart.Instead of looking at one SMA on one timeframe, you see a "wave" or "fan" of SMAs from very fast (1-second) all the way to very slow (1-month). This creates a visual hierarchy of trend strength across different scales.
Key Features: 28 Timeframes covered: 1S, 5S, 10S, 15S, 30S, 1m, 2m, 3m, 5m, 10m, 15m, 20m, 30m, 45m, 60m, 90m, 120m, 180m, 240m, 360m, 480m, 720m, 1D, 2D, 3D, 1W, 2W, 1M.
Color-coded lines with increasing thickness on important timeframes (e.g., 5m is thicker).
Dynamic labels on the right side showing which line belongs to which timeframe (updates on the last bar).
Fill zones between certain groups (1-3m and 60-120m) for visual emphasis.
Info table in top-right showing SMA length and number of timeframes.
Uses request.security() with proper gaps/lookahead settings for clean data.
Trading Interpretation TipsBullish Setup: Price above most SMAs + wave sloping upward + fast TFs above slow TFs.
Bearish Setup: Price below most SMAs + wave sloping downward + fast TFs below slow TFs.
Compression / Breakout Setup: When the "wave" squeezes tightly together → often precedes strong moves.
Divergence: If price makes new highs but the higher-timeframe SMAs are flattening/turning down → warning sign.
Customization IdeasChange SMA len (default 5) — smaller = more reactive, larger = smoother.
Enable/disable fill zones.
Add more plots if you need even more timeframes.
Modify colors and line thickness for better visibility.
Summary:
This indicator is excellent for traders who use multi-timeframe analysis but hate switching between charts. It condenses a huge amount of information into one clean visual "wave," making it much easier to see alignment (or lack thereof) across timeframes. Very useful for day traders, swing traders, and discretionary price action traders who want contextual awareness.
Key Features: 28 Timeframes covered: 1S, 5S, 10S, 15S, 30S, 1m, 2m, 3m, 5m, 10m, 15m, 20m, 30m, 45m, 60m, 90m, 120m, 180m, 240m, 360m, 480m, 720m, 1D, 2D, 3D, 1W, 2W, 1M.
Color-coded lines with increasing thickness on important timeframes (e.g., 5m is thicker).
Dynamic labels on the right side showing which line belongs to which timeframe (updates on the last bar).
Fill zones between certain groups (1-3m and 60-120m) for visual emphasis.
Info table in top-right showing SMA length and number of timeframes.
Uses request.security() with proper gaps/lookahead settings for clean data.
Trading Interpretation TipsBullish Setup: Price above most SMAs + wave sloping upward + fast TFs above slow TFs.
Bearish Setup: Price below most SMAs + wave sloping downward + fast TFs below slow TFs.
Compression / Breakout Setup: When the "wave" squeezes tightly together → often precedes strong moves.
Divergence: If price makes new highs but the higher-timeframe SMAs are flattening/turning down → warning sign.
Customization IdeasChange SMA len (default 5) — smaller = more reactive, larger = smoother.
Enable/disable fill zones.
Add more plots if you need even more timeframes.
Modify colors and line thickness for better visibility.
Summary:
This indicator is excellent for traders who use multi-timeframe analysis but hate switching between charts. It condenses a huge amount of information into one clean visual "wave," making it much easier to see alignment (or lack thereof) across timeframes. Very useful for day traders, swing traders, and discretionary price action traders who want contextual awareness.
开源脚本
秉承TradingView的精神,该脚本的作者将其开源,以便交易者可以查看和验证其功能。向作者致敬!您可以免费使用该脚本,但请记住,重新发布代码须遵守我们的网站规则。

免责声明
这些信息和出版物并非旨在提供,也不构成TradingView提供或认可的任何形式的财务、投资、交易或其他类型的建议或推荐。请阅读使用条款了解更多信息。
开源脚本
秉承TradingView的精神,该脚本的作者将其开源,以便交易者可以查看和验证其功能。向作者致敬!您可以免费使用该脚本,但请记住,重新发布代码须遵守我们的网站规则。
免责声明
这些信息和出版物并非旨在提供,也不构成TradingView提供或认可的任何形式的财务、投资、交易或其他类型的建议或推荐。请阅读使用条款了解更多信息。