Kane's 20 & 200 SMA
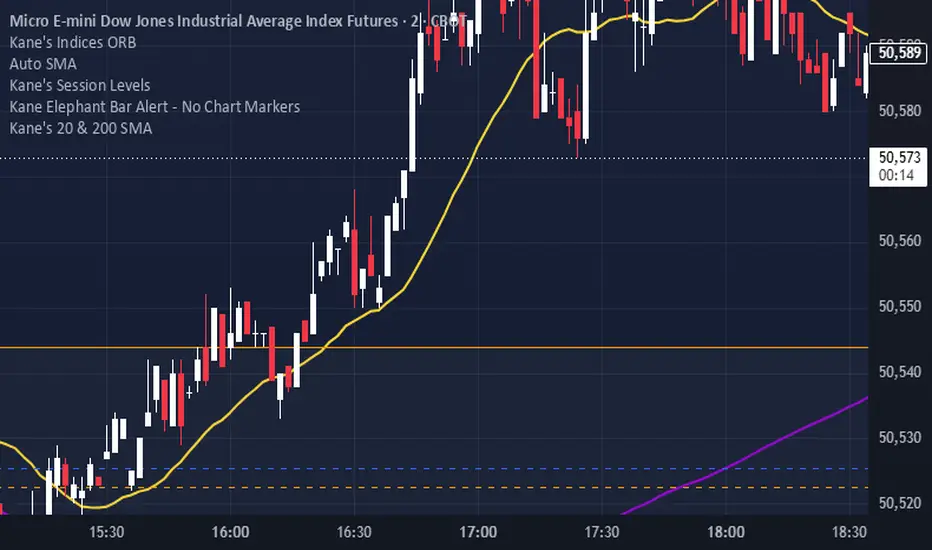
Kane's 20 & 200 SMA
A clean and lightweight dual moving average indicator designed for trend direction, market structure, and long-term bias analysis.
Features:
20 SMA in Yellow
200 SMA in Violet
Smooth overlay directly on price
Minimal chart clutter
Lightweight and responsive on all timeframes
Common Uses:
Identify overall market trend
Determine bullish vs bearish bias
Spot trend continuation setups
Find pullbacks into dynamic support/resistance
Track trend alignment between short and long-term structure
General Interpretation:
20 SMA above 200 SMA = bullish conditions
20 SMA below 200 SMA = bearish conditions
Strong separation can indicate momentum
Compression between averages can indicate consolidation or transition
Works on:
Stocks
Futures
Forex
Crypto
Indices
Gold & Silver
Fully customizable lengths, colors, and line thicknesses in settings.
A clean and lightweight dual moving average indicator designed for trend direction, market structure, and long-term bias analysis.
Features:
20 SMA in Yellow
200 SMA in Violet
Smooth overlay directly on price
Minimal chart clutter
Lightweight and responsive on all timeframes
Common Uses:
Identify overall market trend
Determine bullish vs bearish bias
Spot trend continuation setups
Find pullbacks into dynamic support/resistance
Track trend alignment between short and long-term structure
General Interpretation:
20 SMA above 200 SMA = bullish conditions
20 SMA below 200 SMA = bearish conditions
Strong separation can indicate momentum
Compression between averages can indicate consolidation or transition
Works on:
Stocks
Futures
Forex
Crypto
Indices
Gold & Silver
Fully customizable lengths, colors, and line thicknesses in settings.

免责声明
这些信息和出版物并非旨在提供,也不构成TradingView提供或认可的任何形式的财务、投资、交易或其他类型的建议或推荐。请阅读使用条款了解更多信息。
免责声明
这些信息和出版物并非旨在提供,也不构成TradingView提供或认可的任何形式的财务、投资、交易或其他类型的建议或推荐。请阅读使用条款了解更多信息。