OPEN-SOURCE SCRIPT
Fibonacci Pivot Levels (KenshinC)
══════════════════════════════════════════════════════════════════════════════
FIBONACCI PIVOT LEVELS (KenshinC)
══════════════════════════════════════════════════════════════════════════════
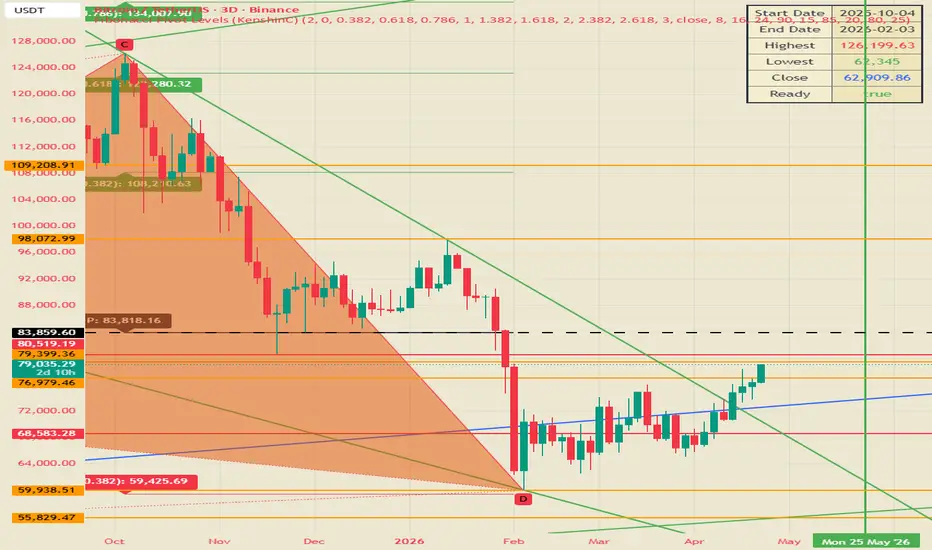
A powerful technical tool that merges classic Pivot Points with Fibonacci ratios
to reveal high-probability support and resistance zones.
By calculating the central Pivot Point (P) from the Highest, Lowest, and Close
prices over your selected period, the indicator automatically projects 10 custom
Fibonacci levels both above and below the pivot — creating clear, precise
horizontal levels that often act as strong price magnets.
Perfect for swing trading, day trading, breakout strategies, and spotting
potential reversals across Forex, Stocks, Crypto, and Commodities.
✨ Additional Feature:
Includes an advanced RSI Predictor that forecasts potential overbought and
oversold zones ahead of time, helping you anticipate momentum shifts.
══════════════════════════════════════════════════════════════════════════════
HOW TO USE
══════════════════════════════════════════════════════════════════════════════
1. Settings Overview
• Start Date & End Date : Choose the period to calculate High, Low & Close
• Use Close Value of End Date? : Use actual close or enter custom value
• Decimal Places : Display precision for price labels
• Fibonacci Rates (1–10) : Customize the 10 Fibonacci ratios
• Show RSI Calculations? : Enable/disable the RSI Predictor lines
2. Understanding the Levels
• P → Central Pivot Point (Black, bold line)
• S1–S10 → Support Levels (Red)
• R1–R10 → Resistance Levels (Green)
Formula:
Pivot (P) = (Highest + Lowest + Close) / 3
Support = P - (Fib Rate × Range)
Resistance = P + (Fib Rate × Range)
3. Information Table
Displays key data in the top-right corner:
- Start & End Date
- Highest & Lowest prices
- Close value used
- Data status
4. RSI Predictor
Plots forward-looking support & resistance based on RSI (length 8, 16, 24)
with customizable overbought/oversold thresholds.
══════════════════════════════════════════════════════════════════════════════
TRADING TIPS
══════════════════════════════════════════════════════════════════════════════
• Price above P → Generally bullish bias (focus on Support levels)
• Price below P → Generally bearish bias (focus on Resistance levels)
• Higher ratios (1.618, 2.000, 2.618, 3.000) often act as major turning zones
• Combine with candlestick patterns or volume for stronger confluences
══════════════════════════════════════════════════════════════════════════════
IMPORTANT DISCLAIMER
══════════════════════════════════════════════════════════════════════════════
This indicator is for educational and informational purposes only.
It is NOT financial advice, investment advice, or a recommendation to buy,
sell, or hold any securities or assets.
Trading involves substantial risk of loss and is not suitable for everyone.
Past performance does not guarantee future results.
Always conduct your own research and consult with a qualified financial advisor
before making any trading or investment decisions.
Use this tool at your own risk.
Created with passion by KenshinC
FIBONACCI PIVOT LEVELS (KenshinC)
══════════════════════════════════════════════════════════════════════════════
A powerful technical tool that merges classic Pivot Points with Fibonacci ratios
to reveal high-probability support and resistance zones.
By calculating the central Pivot Point (P) from the Highest, Lowest, and Close
prices over your selected period, the indicator automatically projects 10 custom
Fibonacci levels both above and below the pivot — creating clear, precise
horizontal levels that often act as strong price magnets.
Perfect for swing trading, day trading, breakout strategies, and spotting
potential reversals across Forex, Stocks, Crypto, and Commodities.
✨ Additional Feature:
Includes an advanced RSI Predictor that forecasts potential overbought and
oversold zones ahead of time, helping you anticipate momentum shifts.
══════════════════════════════════════════════════════════════════════════════
HOW TO USE
══════════════════════════════════════════════════════════════════════════════
1. Settings Overview
• Start Date & End Date : Choose the period to calculate High, Low & Close
• Use Close Value of End Date? : Use actual close or enter custom value
• Decimal Places : Display precision for price labels
• Fibonacci Rates (1–10) : Customize the 10 Fibonacci ratios
• Show RSI Calculations? : Enable/disable the RSI Predictor lines
2. Understanding the Levels
• P → Central Pivot Point (Black, bold line)
• S1–S10 → Support Levels (Red)
• R1–R10 → Resistance Levels (Green)
Formula:
Pivot (P) = (Highest + Lowest + Close) / 3
Support = P - (Fib Rate × Range)
Resistance = P + (Fib Rate × Range)
3. Information Table
Displays key data in the top-right corner:
- Start & End Date
- Highest & Lowest prices
- Close value used
- Data status
4. RSI Predictor
Plots forward-looking support & resistance based on RSI (length 8, 16, 24)
with customizable overbought/oversold thresholds.
══════════════════════════════════════════════════════════════════════════════
TRADING TIPS
══════════════════════════════════════════════════════════════════════════════
• Price above P → Generally bullish bias (focus on Support levels)
• Price below P → Generally bearish bias (focus on Resistance levels)
• Higher ratios (1.618, 2.000, 2.618, 3.000) often act as major turning zones
• Combine with candlestick patterns or volume for stronger confluences
══════════════════════════════════════════════════════════════════════════════
IMPORTANT DISCLAIMER
══════════════════════════════════════════════════════════════════════════════
This indicator is for educational and informational purposes only.
It is NOT financial advice, investment advice, or a recommendation to buy,
sell, or hold any securities or assets.
Trading involves substantial risk of loss and is not suitable for everyone.
Past performance does not guarantee future results.
Always conduct your own research and consult with a qualified financial advisor
before making any trading or investment decisions.
Use this tool at your own risk.
Created with passion by KenshinC
开源脚本
秉承TradingView的精神,该脚本的作者将其开源,以便交易者可以查看和验证其功能。向作者致敬!您可以免费使用该脚本,但请记住,重新发布代码须遵守我们的网站规则。

Made with passion by KenshinC
免责声明
这些信息和出版物并非旨在提供,也不构成TradingView提供或认可的任何形式的财务、投资、交易或其他类型的建议或推荐。请阅读使用条款了解更多信息。
开源脚本
秉承TradingView的精神,该脚本的作者将其开源,以便交易者可以查看和验证其功能。向作者致敬!您可以免费使用该脚本,但请记住,重新发布代码须遵守我们的网站规则。
Made with passion by KenshinC
免责声明
这些信息和出版物并非旨在提供,也不构成TradingView提供或认可的任何形式的财务、投资、交易或其他类型的建议或推荐。请阅读使用条款了解更多信息。