已更新
Session & Levels
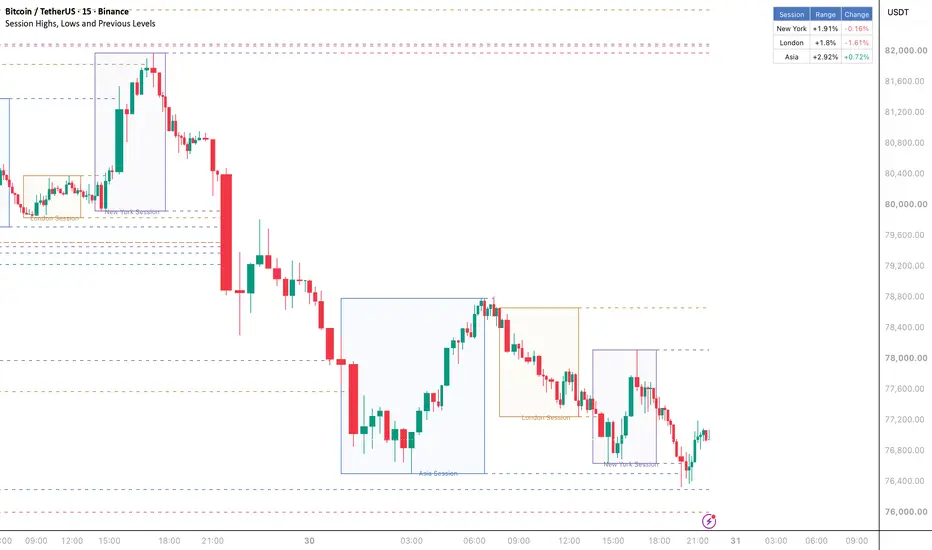
Session Highs, Lows and Previous Levels is an intraday chart indicator for visualizing trading session ranges and key reference levels.
SESSION BOXES
The indicator can display the Asia, London, and New York sessions as outline-only boxes. Each box tracks the session’s high and low while the session is in progress and is finalized when the session ends. A session name is displayed below each completed box.
Session times and the session time zone are configurable. The default schedule uses Etc/UTC:
• Asia: 00:00–06:00
• London: 07:00–12:00
• New York: 13:00–17:00
SESSION HIGH AND LOW LEVELS
When a session completes, its high and low are drawn as horizontal levels. Each level extends forward until price breaks through it. A high is considered broken when a candle’s high moves above the level; a low is considered broken when a candle’s low moves below it. Touching a level without moving beyond it does not invalidate the level. The line ends at the bar that breaks it.
PREVIOUS PERIOD LEVELS
The indicator can also display the previous day’s high and low (PDH and PDL), the previous week’s high and low (PWH and PWL), and the previous month’s high and low (PMH and PML). These levels extend until price breaks through them.
RECENT SESSION STATISTICS
The table in the top-right corner lists the three most recently completed sessions. It shows:
• Range: the difference between the session high and low, expressed as a percentage of the session’s opening price.
• Change: the percentage change from the first in-session bar’s open to the final in-session bar’s close. Positive values indicate an upward move; negative values indicate a downward move.
Display options, session times, time zone, level line width, box border width, and session label spacing can be adjusted in the indicator settings.
This indicator displays price levels and session statistics for chart analysis. It does not place trades or generate trade entry or exit instructions. It is designed for intraday charts; session boundaries and displayed ranges depend on the chart timeframe, symbol data, selected session times, and time zone.
SESSION BOXES
The indicator can display the Asia, London, and New York sessions as outline-only boxes. Each box tracks the session’s high and low while the session is in progress and is finalized when the session ends. A session name is displayed below each completed box.
Session times and the session time zone are configurable. The default schedule uses Etc/UTC:
• Asia: 00:00–06:00
• London: 07:00–12:00
• New York: 13:00–17:00
SESSION HIGH AND LOW LEVELS
When a session completes, its high and low are drawn as horizontal levels. Each level extends forward until price breaks through it. A high is considered broken when a candle’s high moves above the level; a low is considered broken when a candle’s low moves below it. Touching a level without moving beyond it does not invalidate the level. The line ends at the bar that breaks it.
PREVIOUS PERIOD LEVELS
The indicator can also display the previous day’s high and low (PDH and PDL), the previous week’s high and low (PWH and PWL), and the previous month’s high and low (PMH and PML). These levels extend until price breaks through them.
RECENT SESSION STATISTICS
The table in the top-right corner lists the three most recently completed sessions. It shows:
• Range: the difference between the session high and low, expressed as a percentage of the session’s opening price.
• Change: the percentage change from the first in-session bar’s open to the final in-session bar’s close. Positive values indicate an upward move; negative values indicate a downward move.
Display options, session times, time zone, level line width, box border width, and session label spacing can be adjusted in the indicator settings.
This indicator displays price levels and session statistics for chart analysis. It does not place trades or generate trade entry or exit instructions. It is designed for intraday charts; session boundaries and displayed ranges depend on the chart timeframe, symbol data, selected session times, and time zone.
版本注释
Visual update — October 30, 2026Added configurable colors for each session and previous-period group, adjustable soft session fills and four-corner table placement. Made individual level badges optional and hidden by default to reduce overlap. Updated enabled badges and the session table for chart-theme contrast, with smaller panel text and neutral range statistics. Session detection, price tracking, completed-session statistics, previous-period requests and level extension rules remain unchanged.
SESSION & LEVELS
Organize the trading day around time windows and reference prices.
Session & Levels combines two layers of price context: the high and low of completed intraday sessions, and the high and low of the previous day, week and month. Session boxes show how price developed within a selected time window. Projected levels show where those completed ranges remain unbreached.
1. Start with the session clock
Three independent session windows are available. Defaults are Asia 00:00–06:00, London 07:00–12:00 and New York 13:00–17:00, all interpreted using the Session Time Zone input, which defaults to Etc/UTC.
These are editable analysis windows. They are not an automatic exchange-hours calendar. The default UTC windows do not shift automatically to follow the local opening times of London or New York through daylight-saving changes. Set both the windows and time zone deliberately for the market you study. Changing the chart's displayed time zone alone does not replace the indicator's session time-zone input.
2. Follow the active range
During a session, the script tracks its opening price, latest close, highest high and lowest low. When session boxes are enabled, a box grows across the bars belonging to that window and expands vertically as new extremes occur.
The updated defaults use blue for Asia, amber for London and violet for New York. Soft fills help separate the time windows without overwhelming the candles. All three accents, fill transparency and border width can be adjusted. A transparency value of 100 removes the fill. The session-name offset uses ATR to place completed-session captions below the range.
Use an intraday timeframe whose bars align sensibly with your session boundaries. Coarse bars or missing chart data can change the observed extremes and how accurately the chosen time windows are represented.
3. Carry completed session highs and lows forward
After a session ends, its high and low are drawn as dashed horizontal references when that session's display is enabled. These are completed-range levels, so the script does not project the unfinished active session's final high and low in advance.
High-side references continue until a later bar's high is strictly greater than the level. Low-side references continue until a later bar's low is strictly less than the level. An exact touch does not satisfy either strict breach test. The test uses the bar's high or low; it does not require a closing-price break or confirmation of a structural reversal.
When breached, a level stops extending and leaves the active tracking arrays. The existing line and any enabled badge remain on the chart as historical objects, subject to TradingView's drawing limits. A stopped line therefore means that the reference was breached, rather than that the drawing is necessarily deleted.
4. Add the previous-period layer
PDH / PDL denote the previous day's high / low.
PWH / PWL denote the previous week's high / low.
PMH / PML denote the previous month's high / low.
Each pair is added at its corresponding new-period boundary when enabled. The requests use the prior completed higher-timeframe bar. These daily, weekly and monthly boundaries follow the symbol's chart data; they are separate from the custom intraday session windows.
The same extension and breach rules apply to these references. Day, week and month colors are independently configurable, allowing you to distinguish the time horizon without assigning a directional bias to the color.
5. Read the recent-session table
The table reports the three most recently completed sessions recorded by the script. Range is (session high − session low) / session open × 100. Change is (session close − session open) / session open × 100.
Range describes movement size, so its text is neutral. Change uses a positive or negative accent to identify the session's net move. A large range with a small net change can describe substantial two-way activity; it does not establish accumulation or distribution by itself.
The table records completed session statistics independently of the individual session drawing toggles. Hiding Asia's drawing, for example, does not exclude Asia from the recent-session records. Move the table to any corner or hide it using Show Recent Session Stats.
6. A practical workflow
First check the session windows and time zone. Then identify the nearest completed-session references and previous-period levels. Finally, examine how price behaves around those areas using your own structure or execution criteria.
A session high near a previous-day high can create an area worth observing. Price may reject it, trade through it or repeatedly cross it. The indicator maps the references and records the breach; it does not classify those outcomes as valid long or short entries.
Use the session toggles and previous-period toggles to reduce clutter. Named level badges are hidden by default to avoid overlapping labels around nearby references; enable Show Level Badges when you want the individual names. Session captions remain visible. Maximum Active Levels controls how many references remain in active tracking; exceeding the limit removes the oldest tracked line and label. Historical objects that have already stopped extending remain subject to the platform's overall drawing limits.
7. Scope and limitations
This script is a visual reference tool. It contains no built-in alert conditions, entry signals, stop calculations or profit targets. Session statistics summarize the observed chart bars and are not a forecast. Historical drawings, data gaps, chart timeframe and custom session definitions all affect what is visible. Apply the levels within a separately defined analysis and risk-management process.

免责声明
这些信息和出版物并非旨在提供,也不构成TradingView提供或认可的任何形式的财务、投资、交易或其他类型的建议或推荐。请阅读使用条款了解更多信息。