已更新
[blackcat] L2 Ehlers Hilbert Channel Breakout Trading System
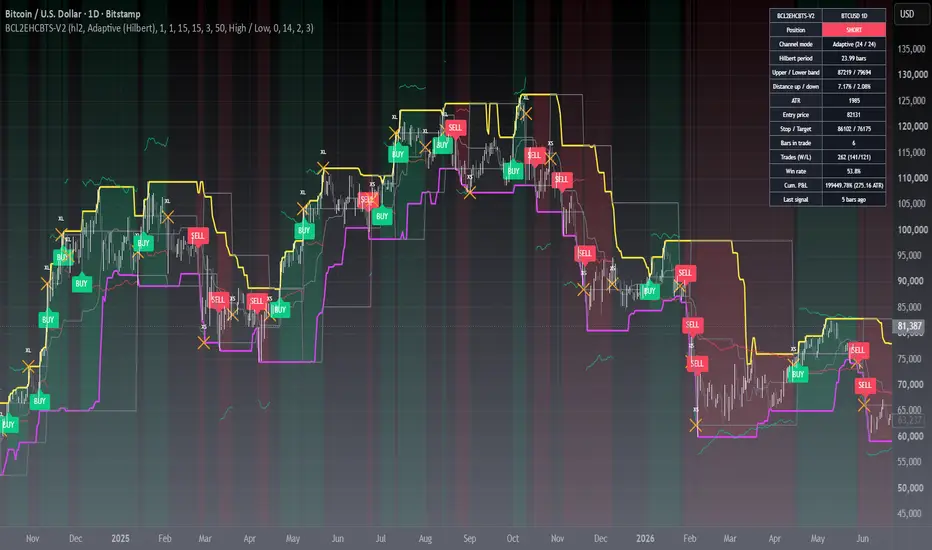
Level: 2
Background
John F. Ehlers introuced Hilbert Channel Breakout Trading System in Nov, 2000.
Function
This indicator will show how the adaptive filter is being applied to a trading strategy. After the Hilbert Channel Breakout Signal is optimized, set the inputs for this indicator to match the corresponding inputs for the signal.
In the March 2000 STOCKS & COMMODITIES, John Ehlers published a algorithm for the Hilbert cycle period, an indicator that plots the length of the current market cycle. The Hilbert transform achieved computational efficiency by using a two-dimensional numbering system. Unfortunately, this introduces amplitude error in calculating the quadrature component. Dr. Ehlers compensated for this error. He have updated the method of compensating for the amplitude error by applying a straight-line compensation term using the frequency calculation from one bar ago. This is possible because the cycle period cannot change drastically from bar to bar. The slowly varying cycle period is adequate to do a good job of amplitude compensation.
In addition, Dr. Ehlers have used a different way to compute the cycle period. He used a homodyne discriminator because it exhibits superior performance in a low signal-to-noise environment. Homodyne means he used the signal multiplied by itself one bar ago to produce a zero-frequency beat note. This beat note carries the phase angle of the one-bar change. Still using the basic definition of a cycle, the one-bar rate of change of phase is exactly the cycle period.
Here is the pine v4 code to generate the signals in the Hilbert channel breakout trading system, as discussed in Dr. Ehlers article in this issue, "Optimizing With Hilbert Indicators." The signal itself is a simple channel breakout system that generates buy and exit signals, that shows whether the system is long or flat; the high of the bar and the value of the entry channel; and the low of the bar and the value of the exit channel. This helps you see on a bar-by-bar basis exactly how the system is behaving.
Key Signal
longcond--> when high breakouts EntryChannel to long
shortcond--> when low breakouts ExitChannel to short
Pros and Cons
100% John F. Ehlers definition translation, even variable names are the same. This help readers who would like to use pine to read his book.
Remarks
The 66th script for Blackcat1402 John F. Ehlers Week publication.
I tested it and believe it work better in small time frame e.g. 15m than large time frames.
Readme
In real life, I am a prolific inventor. I have successfully applied for more than 60 international and regional patents in the past 12 years. But in the past two years or so, I have tried to transfer my creativity to the development of trading strategies. Tradingview is the ideal platform for me. I am selecting and contributing some of the hundreds of scripts to publish in Tradingview community. Welcome everyone to interact with me to discuss these interesting pine scripts.
The scripts posted are categorized into 5 levels according to my efforts or manhours put into these works.
Level 1 : interesting script snippets or distinctive improvement from classic indicators or strategy. Level 1 scripts can usually appear in more complex indicators as a function module or element.
Level 2 : composite indicator/strategy. By selecting or combining several independent or dependent functions or sub indicators in proper way, the composite script exhibits a resonance phenomenon which can filter out noise or fake trading signal to enhance trading confidence level.
Level 3 : comprehensive indicator/strategy. They are simple trading systems based on my strategies. They are commonly containing several or all of entry signal, close signal, stop loss, take profit, re-entry, risk management, and position sizing techniques. Even some interesting fundamental and mass psychological aspects are incorporated.
Level 4 : script snippets or functions that do not disclose source code. Interesting element that can reveal market laws and work as raw material for indicators and strategies. If you find Level 1~2 scripts are helpful, Level 4 is a private version that took me far more efforts to develop.
Level 5 : indicator/strategy that do not disclose source code. private version of Level 3 script with my accumulated script processing skills or a large number of custom functions. I had a private function library built in past two years. Level 5 scripts use many of them to achieve private trading strategy.
Background
John F. Ehlers introuced Hilbert Channel Breakout Trading System in Nov, 2000.
Function
This indicator will show how the adaptive filter is being applied to a trading strategy. After the Hilbert Channel Breakout Signal is optimized, set the inputs for this indicator to match the corresponding inputs for the signal.
In the March 2000 STOCKS & COMMODITIES, John Ehlers published a algorithm for the Hilbert cycle period, an indicator that plots the length of the current market cycle. The Hilbert transform achieved computational efficiency by using a two-dimensional numbering system. Unfortunately, this introduces amplitude error in calculating the quadrature component. Dr. Ehlers compensated for this error. He have updated the method of compensating for the amplitude error by applying a straight-line compensation term using the frequency calculation from one bar ago. This is possible because the cycle period cannot change drastically from bar to bar. The slowly varying cycle period is adequate to do a good job of amplitude compensation.
In addition, Dr. Ehlers have used a different way to compute the cycle period. He used a homodyne discriminator because it exhibits superior performance in a low signal-to-noise environment. Homodyne means he used the signal multiplied by itself one bar ago to produce a zero-frequency beat note. This beat note carries the phase angle of the one-bar change. Still using the basic definition of a cycle, the one-bar rate of change of phase is exactly the cycle period.
Here is the pine v4 code to generate the signals in the Hilbert channel breakout trading system, as discussed in Dr. Ehlers article in this issue, "Optimizing With Hilbert Indicators." The signal itself is a simple channel breakout system that generates buy and exit signals, that shows whether the system is long or flat; the high of the bar and the value of the entry channel; and the low of the bar and the value of the exit channel. This helps you see on a bar-by-bar basis exactly how the system is behaving.
Key Signal
longcond--> when high breakouts EntryChannel to long
shortcond--> when low breakouts ExitChannel to short
Pros and Cons
100% John F. Ehlers definition translation, even variable names are the same. This help readers who would like to use pine to read his book.
Remarks
The 66th script for Blackcat1402 John F. Ehlers Week publication.
I tested it and believe it work better in small time frame e.g. 15m than large time frames.
Readme
In real life, I am a prolific inventor. I have successfully applied for more than 60 international and regional patents in the past 12 years. But in the past two years or so, I have tried to transfer my creativity to the development of trading strategies. Tradingview is the ideal platform for me. I am selecting and contributing some of the hundreds of scripts to publish in Tradingview community. Welcome everyone to interact with me to discuss these interesting pine scripts.
The scripts posted are categorized into 5 levels according to my efforts or manhours put into these works.
Level 1 : interesting script snippets or distinctive improvement from classic indicators or strategy. Level 1 scripts can usually appear in more complex indicators as a function module or element.
Level 2 : composite indicator/strategy. By selecting or combining several independent or dependent functions or sub indicators in proper way, the composite script exhibits a resonance phenomenon which can filter out noise or fake trading signal to enhance trading confidence level.
Level 3 : comprehensive indicator/strategy. They are simple trading systems based on my strategies. They are commonly containing several or all of entry signal, close signal, stop loss, take profit, re-entry, risk management, and position sizing techniques. Even some interesting fundamental and mass psychological aspects are incorporated.
Level 4 : script snippets or functions that do not disclose source code. Interesting element that can reveal market laws and work as raw material for indicators and strategies. If you find Level 1~2 scripts are helpful, Level 4 is a private version that took me far more efforts to develop.
Level 5 : indicator/strategy that do not disclose source code. private version of Level 3 script with my accumulated script processing skills or a large number of custom functions. I had a private function library built in past two years. Level 5 scripts use many of them to achieve private trading strategy.
版本注释
OVERVIEW The [blackcat] L2 Ehlers Hilbert Channel Breakout Trading System is an advanced technical analysis tool that combines Hilbert transform with adaptive channels to identify potential breakout opportunities. It generates buy and sell signals based on price action relative to dynamically calculated entry and exit channels.FEATURES
• Adaptive channel system using Hilbert transform
• Dynamic period calculation for market conditions
• Customizable entry and exit parameters
• Visual breakout signals with colored channels
• Buy/Sell labels for clear trading signals
HOW TO USE
Select the desired price source using the Price input
Configure entry parameters: • EntryVal: Fixed lookback period for entry channel • EntryK: Multiplier for dynamic period calculation
Configure exit parameters: • ExitVal: Fixed lookback period for exit channel • ExitK: Multiplier for dynamic period calculation
Monitor the indicator for channel breakouts and labeled signals
LIMITATIONS
• Requires a minimum of 6 bars for calculations
• Performance may vary in highly volatile markets
• Results depend on proper parameter tuning
• Backtesting recommended before live trading
NOTES
• The indicator uses Hilbert transform for phase angle calculations
• Channels adapt to market conditions through dynamic period calculation
• Buy signals appear when price breaks above the entry channel
• Sell signals appear when price breaks below the exit channel
• Default settings are optimized for most trading scenarios
版本注释
█ OVERVIEWEhlers Hilbert Channel Breakout Trading System V2 turns John Ehlers' dominant-cycle measurement into a trade-ready channel breakout system. It draws an adaptive price channel, marks long and short breakouts, manages positions with an internal state engine, and reports live trading statistics in a dashboard.
█ CONCEPTS
• Adaptive channel: the dominant cycle measured in the market drives the channel length, so the bands follow the market's rhythm instead of a fixed window
• Upper band breakout: price pushing above the recent band marks a long setup
• Lower band breakdown: price breaking below the recent band marks a short setup
• Position engine: entries, exits, reversals and statistics are handled by a state machine, so every signal is an actionable position change
• Volatility-scaled risk: stop-loss and take-profit levels follow current market volatility
█ HOW TO USE
1 — Add the script to a price chart; it draws directly on the candles
2 — Choose a channel length mode and tune it for your market and timeframe
3 — Act on the BUY and SELL labels; the background tint and dashboard confirm the live position
4 — Use the plotted stop-loss and take-profit lines, or manage risk yourself
Channel Engine
• Channel length mode: Adaptive (Hilbert) scales the bands with the measured cycle, Fixed (V1 style) uses static bar counts
• Upper / Lower band length (x Hilbert period) and (fixed bars): adaptive multipliers or static lengths
• Adaptive length floor / ceiling: clamps the adaptive band length
• Breakout trigger: High / Low marks an intrabar breakout, Close waits for the bar close
Signal Governance
• Enable short signals: master switch for short setups
• Confirm signals on bar close: keeps signals free of intrabar flicker
• Same-bar entry/exit exclusivity: when an entry and an exit land on the same bar, the exit wins
• Allow reversal: lets an opposite signal flip an open position instead of waiting
• Signal cooldown bars: minimum spacing between two consecutive signals
Exit Engine and Risk
• Band exit: closes the position when price closes back through the opposite band
• Channel mid-line exit: closes the position at the middle of the channel
• ATR stop-loss / take-profit exit: closes the position on the volatility-based risk levels
• Show ATR TP / SL reference levels, ATR length, Stop-loss (x ATR), Take-profit (x ATR)
Visualization and Alerts
• Draw channel bands, Shade channel body, Draw channel mid-line, Draw last-signal level lines
• Show signal labels, Show V1 raw breakout markers, Position background tint, Information table
• Six ready-made alert channels plus dynamic pushes that include ticker, timeframe and price
• Enable dynamic alert() pushes
• Data window read-outs for cycle length, band lengths, band distances, channel width and cumulative return
█ SIGNALS
• Yellow upper band: the level price must exceed to trigger a long setup
• Magenta lower band: the level price must break to trigger a short setup
• Gray mid line: center of the channel and optional exit level
• Green BUY and red SELL labels: confirmed long and short entries
• Orange XL and XS labels: position exits, tooltips state the exit reason
• Green and red step lines: take-profit and stop-loss levels of the open position
• Faint green and red background: current position state
• Dashboard at the top right: position, cycle length, band values, distances, ATR, risk levels, trade count, share of profitable trades and cumulative return
█ LIMITATIONS
• Signals are confirmed at bar close, so intrabar prices may have crossed the levels earlier
• Breakout systems whipsaw in sideways markets; shorten the bands or widen the risk levels for such conditions
• Risk levels are references, not executed orders, and position sizing stays the trader's responsibility
• Statistics are measured on the script's own signal sequence and do not include costs, slippage or funding
█ NOTES
• Default settings use the adaptive channel; Fixed (V1 style) with 15 bars reproduces the original band layout
• Based on John F. Ehlers' cycle analysis methods. This indicator is an analytical tool, not financial advice — test it on your own data before trading it live
═════════════════════════════════════════════════════════════════════════
For questions or feedback, use comments section below.

Don't miss out! The first and most important thing to do is to join my Discord chat now! Click here to start your adventure: discord.com/invite/ZTGpQJq My new github for more pine development soon: github.com/wxt-coder
免责声明
这些信息和出版物并非旨在提供,也不构成TradingView提供或认可的任何形式的财务、投资、交易或其他类型的建议或推荐。请阅读使用条款了解更多信息。
Don't miss out! The first and most important thing to do is to join my Discord chat now! Click here to start your adventure: discord.com/invite/ZTGpQJq My new github for more pine development soon: github.com/wxt-coder
免责声明
这些信息和出版物并非旨在提供,也不构成TradingView提供或认可的任何形式的财务、投资、交易或其他类型的建议或推荐。请阅读使用条款了解更多信息。