OPEN-SOURCE SCRIPT
Minervini Must Conditions
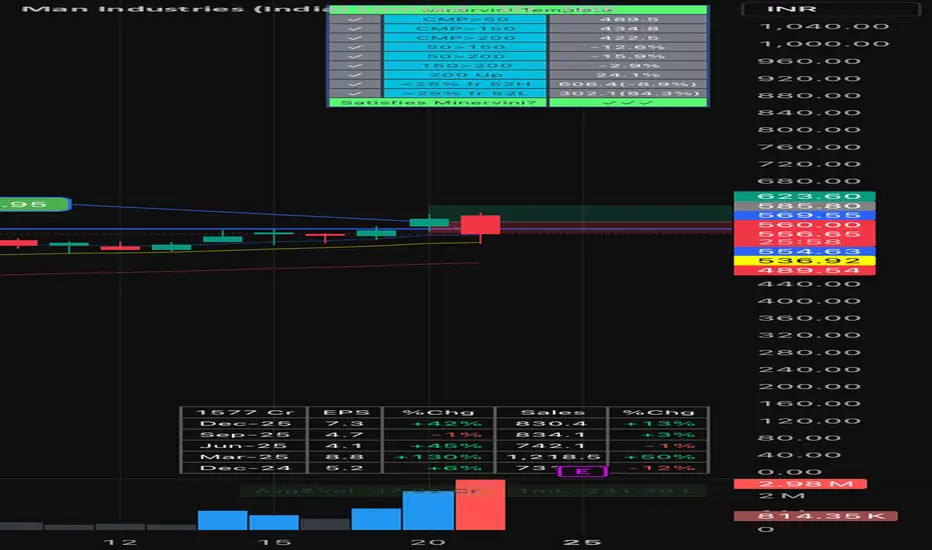
Here's the full description:
Mark Minervini's Trend Template Screener
⚠️ Disclaimer: This indicator is for educational and informational purposes only. It is NOT a buy, sell, or hold recommendation. Always do your own research and consult a SEBI-registered financial advisor before making any investment decisions. Past performance does not guarantee future results.
What is this?
This indicator automates Mark Minervini's famous Trend Template — a checklist he uses to identify stocks in a confirmed Stage 2 uptrend before they make big moves. Minervini is a U.S. Stock Champion (1997) and author of Trade Like a Stock Market Wizard.
The 9 Conditions & Why They Matter:
CMP > 50 MA — Price is above its short-term average. This confirms immediate bullish momentum. If price can't hold above 50 MA, short-term sellers are in control.
CMP > 150 MA — Price is above intermediate trend. This filters out stocks that may have bounced short-term but are still in a broader downtrend.
CMP > 200 MA — Price is above the long-term average. Institutional investors watch 200 MA closely. Trading above it signals big money is supportive.
50 MA > 150 MA — Short-term trend is stronger than intermediate. This means recent buying pressure is accelerating, not fading.
50 MA > 200 MA — Short-term trend leads long-term. Confirms the stock isn't just surviving — it's outperforming its own history.
150 MA > 200 MA — Intermediate trend leads long-term. This is the structural backbone. When this flips bullish, it signals a genuine trend shift, not just a bounce.
200 MA trending up (1 month) — The slowest moving average is rising. This is the hardest condition to fake. A rising 200 MA means sustained accumulation over months.
Within 25% of 52-week high — Stock is near its highs. Minervini avoids "fallen angels" trading far from highs. Stocks near highs have less overhead resistance (trapped sellers) and more momentum.
>25% above 52-week low — Stock has moved significantly off its lows. This eliminates bottom-fishers and ensures the stock has already proven buyer interest with a strong base breakout.
Why all 9 together?
Any single condition can give false signals. A stock above 50 MA might still be in a long-term downtrend. A stock near 52-week highs might have collapsing moving averages. Minervini's genius is stacking all 9 — when every condition aligns, you're looking at a stock where short-term, intermediate, and long-term trends are all bullish, momentum is accelerating, and the price structure confirms institutional accumulation. This drastically reduces the universe of stocks to only the strongest candidates.
How to use:
✓ = condition passed, ✗ = condition failed
All 9 must show ✓ for a stock to qualify
Supports EMA/SMA toggle
Daily timeframe only
Table size and position adjustable
This is a screening tool, not a trading signal. Use it to build your watchlist, then apply your own entry/exit strategy, risk management, and position sizing.
© financetalkswithaman
Mark Minervini's Trend Template Screener
⚠️ Disclaimer: This indicator is for educational and informational purposes only. It is NOT a buy, sell, or hold recommendation. Always do your own research and consult a SEBI-registered financial advisor before making any investment decisions. Past performance does not guarantee future results.
What is this?
This indicator automates Mark Minervini's famous Trend Template — a checklist he uses to identify stocks in a confirmed Stage 2 uptrend before they make big moves. Minervini is a U.S. Stock Champion (1997) and author of Trade Like a Stock Market Wizard.
The 9 Conditions & Why They Matter:
CMP > 50 MA — Price is above its short-term average. This confirms immediate bullish momentum. If price can't hold above 50 MA, short-term sellers are in control.
CMP > 150 MA — Price is above intermediate trend. This filters out stocks that may have bounced short-term but are still in a broader downtrend.
CMP > 200 MA — Price is above the long-term average. Institutional investors watch 200 MA closely. Trading above it signals big money is supportive.
50 MA > 150 MA — Short-term trend is stronger than intermediate. This means recent buying pressure is accelerating, not fading.
50 MA > 200 MA — Short-term trend leads long-term. Confirms the stock isn't just surviving — it's outperforming its own history.
150 MA > 200 MA — Intermediate trend leads long-term. This is the structural backbone. When this flips bullish, it signals a genuine trend shift, not just a bounce.
200 MA trending up (1 month) — The slowest moving average is rising. This is the hardest condition to fake. A rising 200 MA means sustained accumulation over months.
Within 25% of 52-week high — Stock is near its highs. Minervini avoids "fallen angels" trading far from highs. Stocks near highs have less overhead resistance (trapped sellers) and more momentum.
>25% above 52-week low — Stock has moved significantly off its lows. This eliminates bottom-fishers and ensures the stock has already proven buyer interest with a strong base breakout.
Why all 9 together?
Any single condition can give false signals. A stock above 50 MA might still be in a long-term downtrend. A stock near 52-week highs might have collapsing moving averages. Minervini's genius is stacking all 9 — when every condition aligns, you're looking at a stock where short-term, intermediate, and long-term trends are all bullish, momentum is accelerating, and the price structure confirms institutional accumulation. This drastically reduces the universe of stocks to only the strongest candidates.
How to use:
✓ = condition passed, ✗ = condition failed
All 9 must show ✓ for a stock to qualify
Supports EMA/SMA toggle
Daily timeframe only
Table size and position adjustable
This is a screening tool, not a trading signal. Use it to build your watchlist, then apply your own entry/exit strategy, risk management, and position sizing.
© financetalkswithaman
开源脚本
秉承TradingView的精神,该脚本的作者将其开源,以便交易者可以查看和验证其功能。向作者致敬!您可以免费使用该脚本,但请记住,重新发布代码须遵守我们的网站规则。

免责声明
这些信息和出版物并非旨在提供,也不构成TradingView提供或认可的任何形式的财务、投资、交易或其他类型的建议或推荐。请阅读使用条款了解更多信息。
开源脚本
秉承TradingView的精神,该脚本的作者将其开源,以便交易者可以查看和验证其功能。向作者致敬!您可以免费使用该脚本,但请记住,重新发布代码须遵守我们的网站规则。
免责声明
这些信息和出版物并非旨在提供,也不构成TradingView提供或认可的任何形式的财务、投资、交易或其他类型的建议或推荐。请阅读使用条款了解更多信息。