OPEN-SOURCE SCRIPT
Futrues Daily Pivot Zones
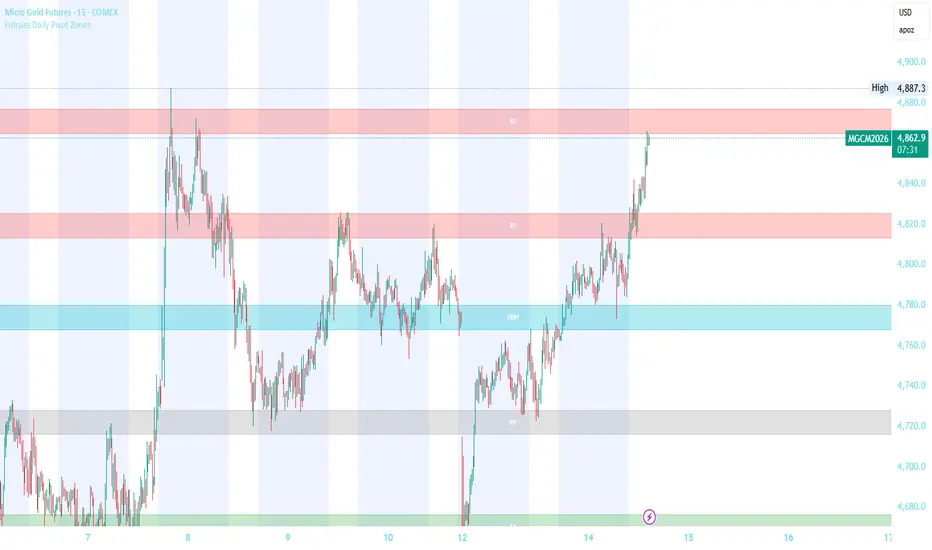
Automatically plots Daily Pivot Point levels as clean rectangle zones directly on your futures chart. Levels are calculated from the previous day's High, Low, and Close — the same levels watched by institutions, banks, and algorithms every single session.
Levels Included:
PP — Main Pivot Point (most watched level of the day)
R1, R2, R3 — Resistance zones above PP
S1, S2, S3 — Support zones below PP
PDH — Previous Day High
PDL — Previous Day Low
How To Use:
Look for price to reject or bounce off a zone in confluence with your EMA bias and VWAP direction. The more factors that agree at a zone — the stronger the trade.
Recommended Zone Buffer By Instrument:
MES (Micro E-Mini S&P 500) → 4.0 - 5.0 points
MNQ (Micro E-Mini Nasdaq) → 8.0 - 10.0 points
MGC (Micro Gold) → 15.0 - 20.0 points
MCL (Micro Crude Oil) → 0.15 - 0.25 points
M2K (Micro Russell 2000) → 3.0 - 4.0 points
Recommended Lookback:
750 bars on a 15-min chart covers approximately 3 trading days of price action.
Levels Included:
PP — Main Pivot Point (most watched level of the day)
R1, R2, R3 — Resistance zones above PP
S1, S2, S3 — Support zones below PP
PDH — Previous Day High
PDL — Previous Day Low
How To Use:
Look for price to reject or bounce off a zone in confluence with your EMA bias and VWAP direction. The more factors that agree at a zone — the stronger the trade.
Recommended Zone Buffer By Instrument:
MES (Micro E-Mini S&P 500) → 4.0 - 5.0 points
MNQ (Micro E-Mini Nasdaq) → 8.0 - 10.0 points
MGC (Micro Gold) → 15.0 - 20.0 points
MCL (Micro Crude Oil) → 0.15 - 0.25 points
M2K (Micro Russell 2000) → 3.0 - 4.0 points
Recommended Lookback:
750 bars on a 15-min chart covers approximately 3 trading days of price action.
开源脚本
秉承TradingView的精神,该脚本的作者将其开源,以便交易者可以查看和验证其功能。向作者致敬!您可以免费使用该脚本,但请记住,重新发布代码须遵守我们的网站规则。

免责声明
这些信息和出版物并非旨在提供,也不构成TradingView提供或认可的任何形式的财务、投资、交易或其他类型的建议或推荐。请阅读使用条款了解更多信息。
免责声明
这些信息和出版物并非旨在提供,也不构成TradingView提供或认可的任何形式的财务、投资、交易或其他类型的建议或推荐。请阅读使用条款了解更多信息。