OPEN-SOURCE SCRIPT
RSI with Zone Background Fill
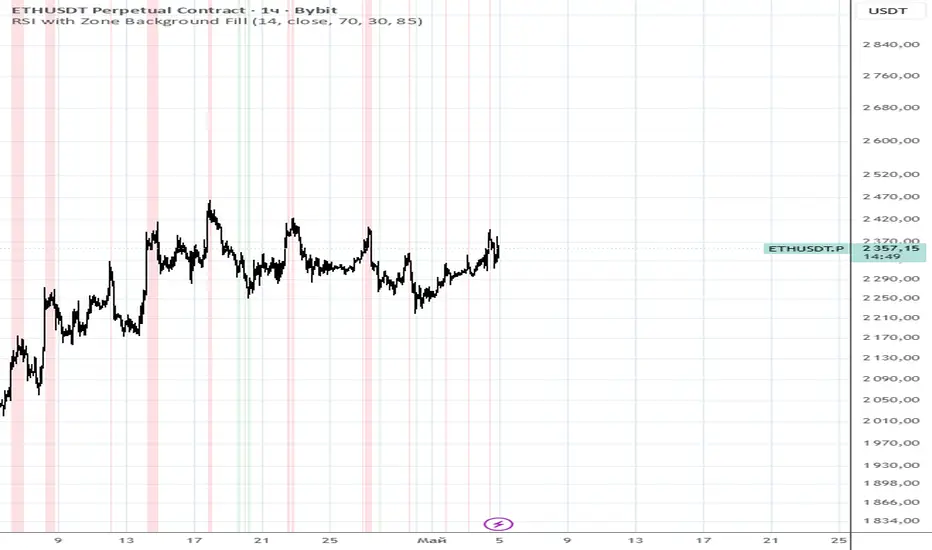
This indicator visually highlights overbought and oversold RSI zones directly on the price chart (since overlay=true).
What it does exactly:
Calculates the standard RSI (period 14, source close).
When RSI is above the specified level (default 70) — the chart background is colored reddish (overbought).
When RSI is below the specified level (default 30) — the background is colored greenish (oversold).
Fill transparency is adjustable (default 85% — barely noticeable).
The RSI line itself is not drawn on the chart (it is only displayed in the Data Window) to avoid cluttering the price chart.
Why it's useful:
To quickly see when the price is in extreme RSI zones without opening a separate indicator window. Convenient for context — for example, to look for reversals or confirm overbought/oversold conditions directly on the candles.https://prnt.sc/LvQLG-ft971R
开源脚本
秉承TradingView的精神,该脚本的作者将其开源,以便交易者可以查看和验证其功能。向作者致敬!您可以免费使用该脚本,但请记住,重新发布代码须遵守我们的网站规则。

免责声明
这些信息和出版物并非旨在提供,也不构成TradingView提供或认可的任何形式的财务、投资、交易或其他类型的建议或推荐。请阅读使用条款了解更多信息。
免责声明
这些信息和出版物并非旨在提供,也不构成TradingView提供或认可的任何形式的财务、投资、交易或其他类型的建议或推荐。请阅读使用条款了解更多信息。