已更新
Z-Score Probability Pro KAMA
Z-Score Probability Pro KAMA, v1.0 by Erika Barker
Hey guys, this is the successor to my original Z-Score Probability HMA Indicator, which you can still use if you prefer that one.
This is version 1.0 of the new rebuild, and it is a pretty big upgrade. The goal was to keep the statistical foundation that made the original useful, but make it more adaptive, cleaner, and better at understanding different market conditions.
What is new
1. Timeframe auto-adaptation
No more constantly re-tuning the indicator when you switch charts.
The lookback now automatically adjusts based on the chart timeframe, using a calendar-style window, defaulting to about 5 trading days. The dashboard also shows the effective lookback being used, so you always know what the script is calculating from.
It works from 1 minute charts all the way up to weekly charts.
2. Better smoothing logic
The original HMA was doing a lot of work at once. In this version, the baseline and the Z-score smoothing are separated so each one can do its own job better.
By default:
* Baseline: KAMA, great for adapting to noisy markets
* Z-score smoothing: ALMA, smoother and cleaner on the oscillator
HMA is still available if you prefer the original feel.
3. Modified Z-Score option
There is now an optional Modified Z-Score mode using MAD, median absolute deviation.
This is useful for markets with big outliers, fat tails, sudden spikes, crypto moves, small caps, and anything that tends to behave a little wild.
When this mode is turned on, the threshold bands automatically adjust.
4. Regime filter using Hurst logic (been needing out on this a lot lately on personal stuff)
This version attempts to classify the market as:
* Trending
* Mean-reverting
* Random
That matters because an extreme Z-score does not always mean the same thing.
In a mean-reverting market, an extreme Z-score can suggest exhaustion.
In a trending market, that same extreme can sometimes mean continuation or breakout strength.
This was one of the biggest things I wanted to improve from the original.
5. Divergence engine
The indicator now includes both regular and hidden divergence.
It can detect:
* Regular bullish divergence
* Regular bearish divergence
* Hidden bullish divergence
* Hidden bearish divergence
Divergences are confirmed using pivots, so they are non-repainting, but they will appear a few bars after the actual pivot. That is the tradeoff for confirmation.
6. Higher-timeframe confirmation
The script can pull Z-score confirmation from a higher timeframe.
You can use the automatic HTF mode or set it manually. HTF values only update after the higher-timeframe candle closes, so this is designed to avoid repainting.
7. Strong Buy and Strong Sell signals
Signals are based on a confluence score instead of just one condition.
The score looks at things like:
* Z-score reversal
* Divergence
* Baseline slope
* Market regime
* Higher-timeframe agreement
* Volume confirmation, when volume is available
You can choose the conviction level:
* Low
* Medium
* High
Medium is the default and should give fewer, cleaner signals.
8. Live dashboard
The dashboard shows:
* Detected timeframe
* Effective lookback
* Current Z-score
* Market regime
* Hurst value
* Higher-timeframe status
* Bull and bear scores
* Conviction threshold
* Last signal
You can move it to any corner of the chart.
9. More stable defaults
The defaults were chosen to be centered in stable performance zones, not over-optimized for one market.
Basically, I did not want this to be something that only looks good on one ticker, one timeframe, during one perfect backtest window.
10. Built in Pine v6
This version uses Pine v6 features, including dynamic higher-timeframe requests and confirmed-bar alert logic.
Repaint disclosure
This indicator is designed to avoid repainting, but there are a few things to know:
* Divergence and Strong Buy/Sell labels appear after pivot confirmation, default is 3 bars later
* Higher-timeframe confirmation only updates after the higher-timeframe candle closes
* Alerts fire on confirmed bars, not intrabar ticks
So, signals are delayed slightly by design, but that is what makes them confirmed.
How to use it
Beginner
Leave everything on default.
Watch the dashboard and look for:
* Strong Buy
* Strong Sell
Medium conviction is probably the best starting point.
Intermediate
Try the Modified Z-Score mode on crypto, small caps, or anything with sharp moves and big outliers.
Turn on Hidden Divergence if you like trading trend continuation setups.
Advanced
You can tune the component weights to match your own strategy.
The indicator is flexible, so you can make it more reversal-focused, more trend-following, or more confirmation-heavy depending on your trading style.
版本注释
v3.1 Update:Simple changes to this minor update. I better tuned the Z-Wave on all Time Frames, and Buy and Sell Signals.
版本注释
Confirmed signals, automatic defaults, and a clearer timing guideThis update keeps the KAMA-based oscillator and makes its calculations and signal timing more explicit. Add it to a standard candlestick chart and leave Auto-Adapt enabled: the lookback and higher timeframe change automatically when you change the chart timeframe. Advanced inputs remain available.
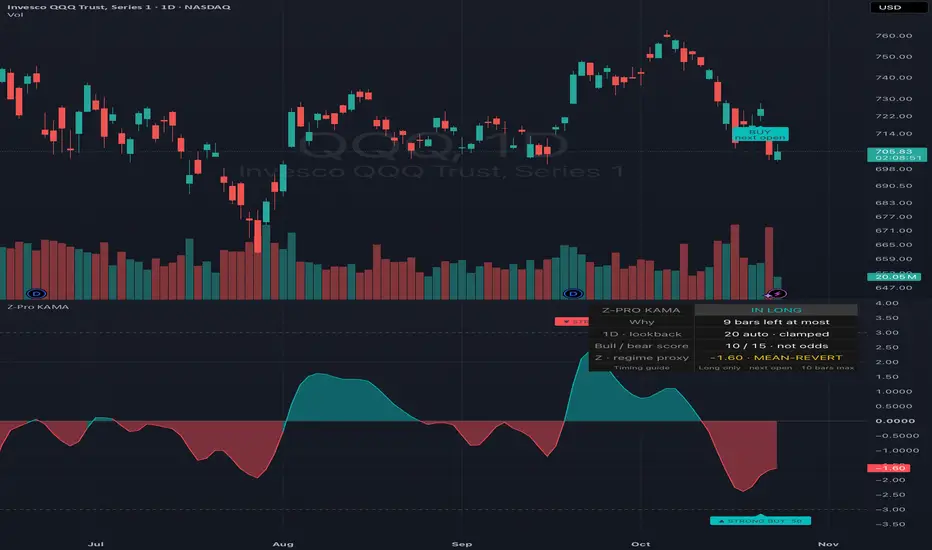
THE INTERFACE — QQQ DAILY EXAMPLE
The upper chart shows the timing guide's BUY NEXT OPEN and EXIT NEXT OPEN instructions. The lower pane shows standardized distance from the adaptive baseline and confirmed confluence markers. Read the panel at the upper right of that pane for the current hypothetical state, reason, automatic lookback and remaining holding horizon. A historical BUY label stays on its signal bar; IN LONG means the guide subsequently entered at the following open. This is a working interface example, not a recommendation to buy QQQ now.
WHAT CHANGED
• Classical Z now centers the rolling residual before dividing by its standard deviation. The optional modified Z uses absolute deviations from one current-window median, correcting the previous MAD calculation.
• Higher-timeframe evidence uses the last two completed HTF bars. Buy/sell events and alerts wait for the chart bar to close. Divergence appears when the pivot is confirmed, not retrospectively at the pivot.
• Disabled confirmations no longer remain in the score denominator. Missing volume is handled separately. Warmup prevents the timing guide from issuing entries before its required inputs are ready.
• A compact panel answers one practical question: WAIT, BUY NEXT OPEN, IN LONG, or EXIT NEXT OPEN. Price-chart labels show the same entry and exit instructions.
• Research-selected defaults are a 3-day scaling target and confluence score 50 (Low), with KAMA, ALMA(9), and the existing component weights. Lookback is clamped to 20–200 bars: this is an automatic heuristic, not an exact number of trading sessions. The panel shows when it is clamped.
HOW TO READ IT
The oscillator measures standardized distance relative to an adaptive baseline. A weighted score combines extreme reversal, confirmed divergence, baseline slope, a variance-ratio regime proxy, completed higher-timeframe evidence, and volume. Its contribution is bringing those existing ideas into one automatic, close-confirmed workflow with visible entry/exit timing; it does not invent KAMA or a new probability law.
Scores measure agreement between rules, not the probability that a trade will win. The optional normal-reference table is mathematical reference information, not a forecast. The oscillator and dashboard measurements can move during the open candle; actionable events wait for confirmation. Confirmed HTF data introduces intentional delay. The regime label is a proxy, not a calibrated Hurst forecast.
The timing guide is long-only and hypothetical: enter at the open following a confirmed buy, then exit at the open following an opposite strong-sell signal or after 10 holding bars, whichever comes first. It is independent of your actual holdings and does not place orders. Other bearish markers describe bearish evidence; they are not automatic short entries. The optional EMA200 entry filter was tested but was too sparse to establish a benefit, so it remains off.
BACKTEST EVIDENCE — AS OF OCTOBER 23, 2026
The original indicator had no exit policy, so a “win rate” is meaningful only for the explicit timing policy above. A companion strategy using the identical Pine logic was run on standard candles, regular sessions, next-open market fills, one share per entry, no pyramiding, and 0.05% commission on each side. There was no additional spread, slippage or market-impact model. These are historical simulations, not live results or a portfolio allocation model.
All native checks are listed below. Format: closed trades / profitable trades / profit factor. Date ranges are the loaded ranges reported by TradingView, including warmup; they differ and are not a controlled ranking. All end October 23, 2026.
• SPY daily, from Jan 29 1993: 86 / 54.65% / 1.753.
• SPY 4-hour, from Jan 3 2006: 50 / 52.00% / 0.908.
• QQQ daily, from Mar 10 1999: 66 / 68.18% / 1.992.
• QQQ 4-hour, from Jan 3 2006: 36 / 69.44% / 1.593.
• NVDA daily, from Jan 22 1999: 42 / 54.76% / 0.727.
• JPM daily, from Mar 5 1969: 80 / 63.75% / 1.626.
• JPM hourly, from Jan 4 2021: 63 / 55.56% / 1.617.
• JPM 15-minute, from Apr 1 2025: 35 / 51.43% / 1.040.
• MRNA 15-minute, from Apr 1 2025: 35 / 42.86% / 0.689.
An additional approximate Python study covered AAPL, MSFT, NVDA, AMZN, JPM, XOM, UNH, WMT, CAT, DIS, F, KO, SPY, QQQ, IWM, DIA, TLT, GLD, XLF and XLE on 15-minute, hourly, 4-hour and daily data. Eleven declared candidates were compared; the settings above were frozen from validation before final evaluation. The sample is a chosen cross-section, not a random or survivorship-free universe. Yahoo adjusted data, session aggregation and multi-day alignment differ from TradingView; numerical parity has not been established.
The strict common-date evaluation, October 6–22 2026, had only 22 completed trades: 45.45% wins and profit factor 1.015 after hypothetical 5-basis-point costs per side. At 10 basis points per side, its profit factor fell to 0.823. A separate transfer study on six symbols excluded from tuning had 211 trades, 52.61% wins and profit factor 1.072 at 5 basis points per side. That transfer test spans different dates and correlated markets; it is not a clean chronological holdout. Earlier mixed-date results were excluded from the headline conclusion after a review identified calendar overlap.
WHERE TO START
QQQ daily and JPM daily are the most promising examples from the native checks; QQQ 4-hour is also worth further paper evaluation. SPY 4-hour, NVDA daily and MRNA 15-minute show why a high win rate or a good-looking chart is insufficient. Hourly results were weak across the broader external sample, although JPM's native hourly test was stronger. These are research priorities, not proven future rankings.
A general 55% winning-trade edge was NOT established. The strict unseen sample is small, the higher-threshold baseline was too sparse for a reliable superiority comparison, and no setting is claimed optimal for every market or timeframe. This release improves calculation integrity, automatic operation and clarity; it does not claim universally improved profitability. No machine-learning model was trained or embedded. The chart snapshot illustrates the interface and is not evidence of future performance.

免责声明
这些信息和出版物并非旨在提供,也不构成TradingView提供或认可的任何形式的财务、投资、交易或其他类型的建议或推荐。请阅读使用条款了解更多信息。
免责声明
这些信息和出版物并非旨在提供,也不构成TradingView提供或认可的任何形式的财务、投资、交易或其他类型的建议或推荐。请阅读使用条款了解更多信息。