Heartland Previous-Day Pivot Levels
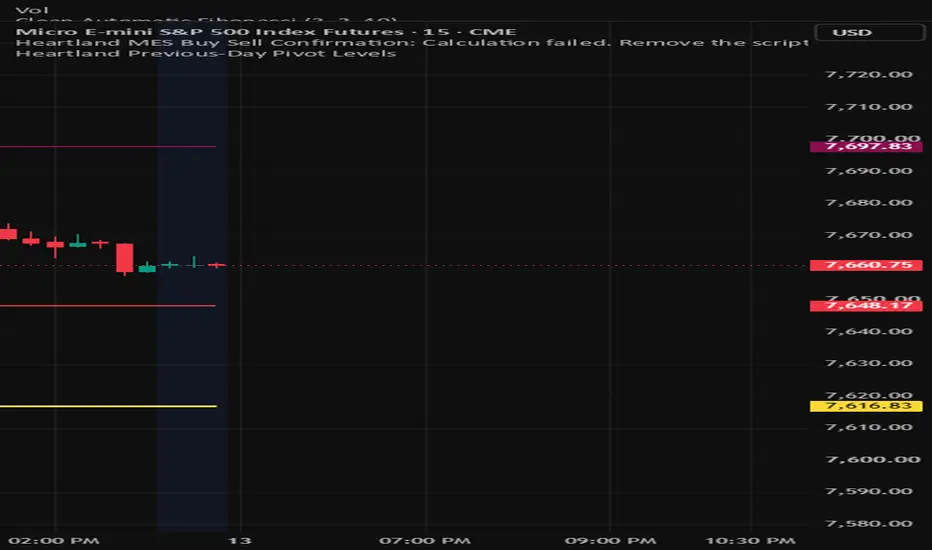
This indicator calculates traditional pivot levels using the previous completed trading day’s high, low and closing price. It displays the central equilibrium pivot, R1 and R2 resistance levels, and S1 and S2 support levels. The levels update automatically at the beginning of each new trading day and can help traders identify market direction, potential support and resistance, and possible profit targets. This indicator is intended for educational and market-analysis purposes only and should not be considered financial advice.

免责声明
这些信息和出版物并非旨在提供,也不构成TradingView提供或认可的任何形式的财务、投资、交易或其他类型的建议或推荐。请阅读使用条款了解更多信息。
免责声明
这些信息和出版物并非旨在提供,也不构成TradingView提供或认可的任何形式的财务、投资、交易或其他类型的建议或推荐。请阅读使用条款了解更多信息。