OPEN-SOURCE SCRIPT
NQ Reversal Toolkit
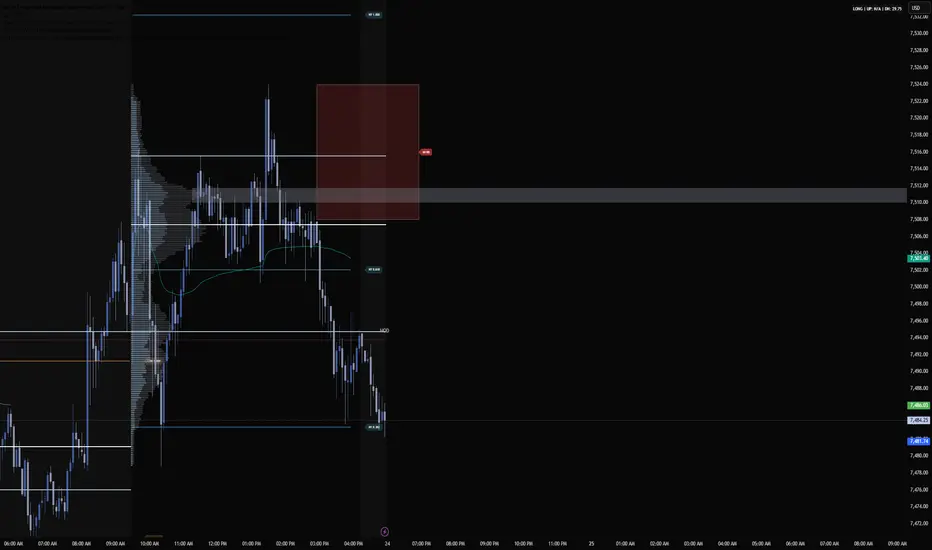
This toolkit operates via three specialized internal modules, culminating in a real-time HUD (Heads-Up Display) overlay.
1. Session-Based Fib Pivots (MotiveWave-Style)
Unlike standard daily pivot calculations, this script isolates explicit trading sessions (Asia, London, New York) and computes Fibonacci ranges derived strictly from the prior completed sequence of that exact session.
Execution Value: Rather than relying on generic daily targets, this charts key institutional intraday micro-structures. You can track when NY is breaking or rejecting lines calculated from yesterday's NY session.Hourly Flex: Includes a secondary toggle to project dynamic 1-Hour rolling Fib Pivots directly across your chart workspace.2. High-Timeframe (HTF) Rejection BlocksThis module actively monitors higher timeframes (defaults to the 60-minute chart) to scan for institutional order flow rejections. It identifies candles displaying massive wick-to-body expansion ratios coupled with an ATR threshold validation.Bullish Rejection Block: Drawn when a massive lower wick indicates aggressive buy-side absorption at key support.Bearish Rejection Block: Drawn when a massive upper wick reveals institutional selling pressure at structural resistance.Auto-Mitigation: To keep charts clean and relevant, zones automatically delete the exact millisecond price breaks through the invalidation floor/ceiling of the block.3. Session Volume Profile (VP)Volume profiles calculate the volume distribution across price ranges over distinct chronological sessions (NY session, Overnight, or Weekly).POC (Point of Control): The brightest horizontal axis representing the absolute heaviest volume node where major commercial interest accumulated.VAH / VAL (Value Area High / Low): Boundaries containing the specified percentage (default 70%) of all transacted session volume.Execution Value: Markets trend from Value Area to Value Area, and reverse or accept at the Point of Control.4. Dynamic Workspace HUDThe Heads-Up Display anchored in the top-right corner aggregates data from all modules simultaneously. It calculates the midpoints of active ranges to output an instant institutional bias framework:LONG: Market price is structural over the global network midpoint.SHORT: Market price is tracking below the global network midpoint.UP / DN Metaphorical Distances: Live ticker measuring exactly how many index points remain until NQ hits the next immediate overhead resistance level or floor support.🛠️ Key Inputs & CustomizationOpen the indicator settings window ($⚙$) to fine-tune your parameters:Timezone Matching: Set your exact location input (Defaults to America/New_York) to line up your structural session pivots accurately.Wick / Body Ratio: Located under Rejection Blocks. Increase this value if you want the algorithm to filter for only ultra-aggressive, high-conviction institutional wicks.Volume Profile Rows: Adjust rows (up to 300) to change the resolution density of your volume profiles. Higher values create finer grain structures.
1. Session-Based Fib Pivots (MotiveWave-Style)
Unlike standard daily pivot calculations, this script isolates explicit trading sessions (Asia, London, New York) and computes Fibonacci ranges derived strictly from the prior completed sequence of that exact session.
Execution Value: Rather than relying on generic daily targets, this charts key institutional intraday micro-structures. You can track when NY is breaking or rejecting lines calculated from yesterday's NY session.Hourly Flex: Includes a secondary toggle to project dynamic 1-Hour rolling Fib Pivots directly across your chart workspace.2. High-Timeframe (HTF) Rejection BlocksThis module actively monitors higher timeframes (defaults to the 60-minute chart) to scan for institutional order flow rejections. It identifies candles displaying massive wick-to-body expansion ratios coupled with an ATR threshold validation.Bullish Rejection Block: Drawn when a massive lower wick indicates aggressive buy-side absorption at key support.Bearish Rejection Block: Drawn when a massive upper wick reveals institutional selling pressure at structural resistance.Auto-Mitigation: To keep charts clean and relevant, zones automatically delete the exact millisecond price breaks through the invalidation floor/ceiling of the block.3. Session Volume Profile (VP)Volume profiles calculate the volume distribution across price ranges over distinct chronological sessions (NY session, Overnight, or Weekly).POC (Point of Control): The brightest horizontal axis representing the absolute heaviest volume node where major commercial interest accumulated.VAH / VAL (Value Area High / Low): Boundaries containing the specified percentage (default 70%) of all transacted session volume.Execution Value: Markets trend from Value Area to Value Area, and reverse or accept at the Point of Control.4. Dynamic Workspace HUDThe Heads-Up Display anchored in the top-right corner aggregates data from all modules simultaneously. It calculates the midpoints of active ranges to output an instant institutional bias framework:LONG: Market price is structural over the global network midpoint.SHORT: Market price is tracking below the global network midpoint.UP / DN Metaphorical Distances: Live ticker measuring exactly how many index points remain until NQ hits the next immediate overhead resistance level or floor support.🛠️ Key Inputs & CustomizationOpen the indicator settings window ($⚙$) to fine-tune your parameters:Timezone Matching: Set your exact location input (Defaults to America/New_York) to line up your structural session pivots accurately.Wick / Body Ratio: Located under Rejection Blocks. Increase this value if you want the algorithm to filter for only ultra-aggressive, high-conviction institutional wicks.Volume Profile Rows: Adjust rows (up to 300) to change the resolution density of your volume profiles. Higher values create finer grain structures.
开源脚本
秉承TradingView的精神,该脚本的作者将其开源,以便交易者可以查看和验证其功能。向作者致敬!您可以免费使用该脚本,但请记住,重新发布代码须遵守我们的网站规则。

免责声明
这些信息和出版物并非旨在提供,也不构成TradingView提供或认可的任何形式的财务、投资、交易或其他类型的建议或推荐。请阅读使用条款了解更多信息。
开源脚本
秉承TradingView的精神,该脚本的作者将其开源,以便交易者可以查看和验证其功能。向作者致敬!您可以免费使用该脚本,但请记住,重新发布代码须遵守我们的网站规则。
免责声明
这些信息和出版物并非旨在提供,也不构成TradingView提供或认可的任何形式的财务、投资、交易或其他类型的建议或推荐。请阅读使用条款了解更多信息。