Buffett Intrinsic Value
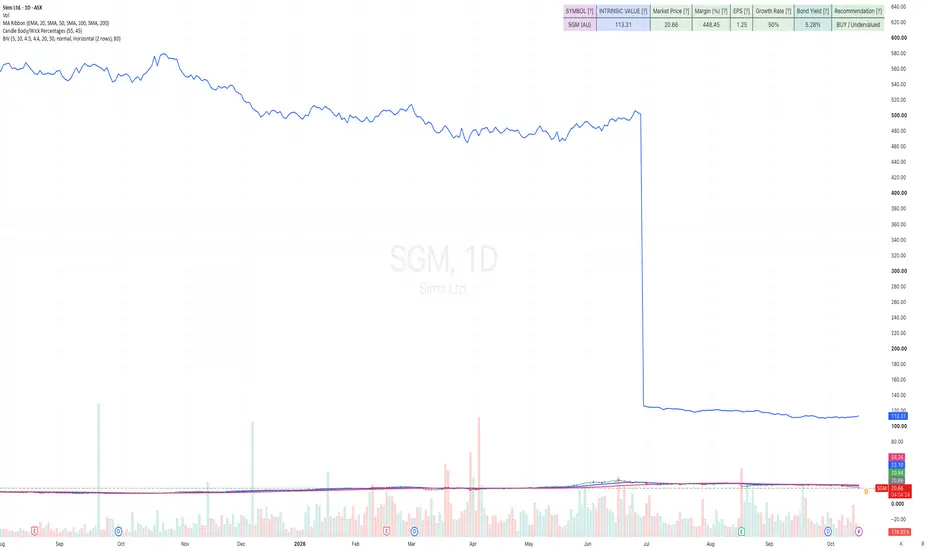
The Buffett Intrinsic Value (BIV) indicator evaluates whether a stock is trading at a discount or premium relative to its fundamental valuation. Based on Benjamin Graham and Warren Buffett’s valuation framework, this indicator calculates intrinsic value by combining auto-fetched fundamental financial data (EPS TTM, Sustainable Growth Rate) with live regional 10-Year AAA/Government bond yields.
It features an interactive, real-time dashboard directly on your TradingView chart canvas that outputs fair value, margin of safety, and automated BUY/HOLD/SELL trade bias recommendations.
FeaturesAutomated Fundamental Data Fetching:EPS TTM: Automatically requests trailing twelve-month Earnings Per Share using TradingView's request.financial() engine.Sustainable Growth Rate (SGR): Dynamically calculates growth rate using Return on Equity (ROE) and Dividend Retention Ratio ($\text{SGR} = \text{ROE} \times (1 - \text{Payout Ratio})$).YoY Growth Fallback: Automatically defaults to Year-over-Year EPS growth or manual user inputs if financial metrics are missing.Global Multi-Region Bond Yield Auto-Detection:Automatically detects the stock's country of origin via syminfo.country and pulls the relevant 10-Year Government Bond yield (US10Y, IN10Y, GB10Y, DE10Y, JP10Y, CN10Y, AU10Y, CA10Y).Margin of Safety & Valuation Recommendations:Computes discount/premium percentages relative to market price.Flags status as BUY (Undervalued with Margin of Safety), HOLD (Fairly Valued), or SELL (Overvalued).Fully Customizable Display Dashboard:Multi-layout support: Vertical (2 columns), Horizontal (2 rows), and Compact Horizontal modes.Customizable background colors, transparency, and text sizing.Visual trend plots for Intrinsic Value vs. Market Price directly on chart pane.
It features an interactive, real-time dashboard directly on your TradingView chart canvas that outputs fair value, margin of safety, and automated BUY/HOLD/SELL trade bias recommendations.
FeaturesAutomated Fundamental Data Fetching:EPS TTM: Automatically requests trailing twelve-month Earnings Per Share using TradingView's request.financial() engine.Sustainable Growth Rate (SGR): Dynamically calculates growth rate using Return on Equity (ROE) and Dividend Retention Ratio ($\text{SGR} = \text{ROE} \times (1 - \text{Payout Ratio})$).YoY Growth Fallback: Automatically defaults to Year-over-Year EPS growth or manual user inputs if financial metrics are missing.Global Multi-Region Bond Yield Auto-Detection:Automatically detects the stock's country of origin via syminfo.country and pulls the relevant 10-Year Government Bond yield (US10Y, IN10Y, GB10Y, DE10Y, JP10Y, CN10Y, AU10Y, CA10Y).Margin of Safety & Valuation Recommendations:Computes discount/premium percentages relative to market price.Flags status as BUY (Undervalued with Margin of Safety), HOLD (Fairly Valued), or SELL (Overvalued).Fully Customizable Display Dashboard:Multi-layout support: Vertical (2 columns), Horizontal (2 rows), and Compact Horizontal modes.Customizable background colors, transparency, and text sizing.Visual trend plots for Intrinsic Value vs. Market Price directly on chart pane.

Regards,
Anand Vardhan
Anand Vardhan
免责声明
这些信息和出版物并非旨在提供,也不构成TradingView提供或认可的任何形式的财务、投资、交易或其他类型的建议或推荐。请阅读使用条款了解更多信息。
Regards,
Anand Vardhan
Anand Vardhan
免责声明
这些信息和出版物并非旨在提供,也不构成TradingView提供或认可的任何形式的财务、投资、交易或其他类型的建议或推荐。请阅读使用条款了解更多信息。