OPEN-SOURCE SCRIPT
已更新 Graveyard Pivots Price Magnet
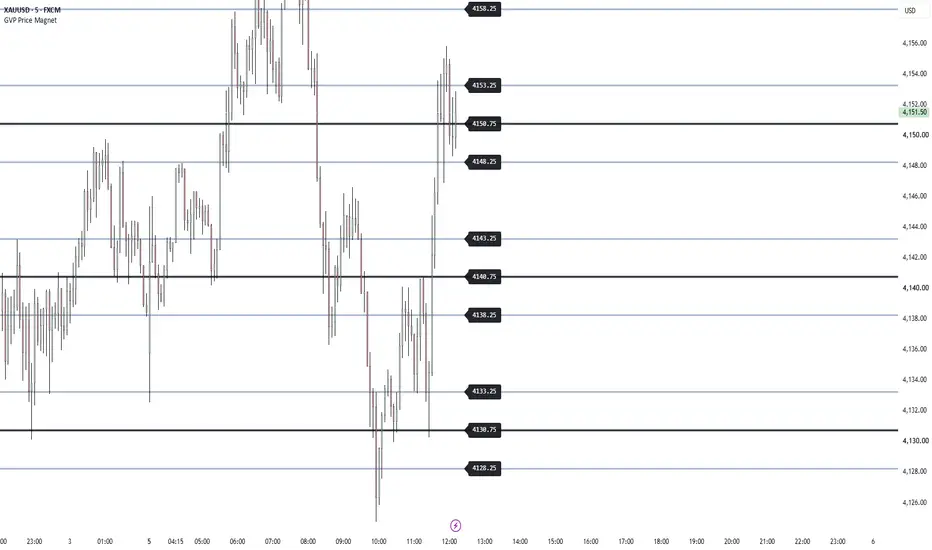
Graveyard Pivots
Graveyard Pivots draws a fresh grid of price levels every day, measured from the daily open. It marks the quarter levels (.25, .50 and .75) between each pair of main round-number levels, so you can see where price may stall, react or reverse.
How it works
*Daily anchor. The grid starts from the daily open, so it resets at the start of each new day.
*Automatic step size. The gap between main levels is set from the timeframe and the instrument's tick size and price scale, so it works on forex, stocks, crypto and indices without manual setup.
*Quarter levels. Between each pair of main levels, the script draws a .25 line, a .50 core line and a .75 line.
*Core line. The .50 line is drawn thicker, in black, with a soft glow, so it stands out as the key level.
*Edge lines. The .25 and .75 lines are drawn in light blue.
Settings
*Graves each side of price: how many levels to show above and below price (up to 60 each side).
*Anchor source: Daily Open (default), Prev Day Close, Weekly Open, Monthly Open, Yearly Open, or Zero for a fixed grid that never resets.
*Line widths and colours for the core and edge lines.
*Price tags: optional labels showing each level's price, with an adjustable distance from the last bar.

Graveyard Pivots draws a fresh grid of price levels every day, measured from the daily open. It marks the quarter levels (.25, .50 and .75) between each pair of main round-number levels, so you can see where price may stall, react or reverse.
How it works
*Daily anchor. The grid starts from the daily open, so it resets at the start of each new day.
*Automatic step size. The gap between main levels is set from the timeframe and the instrument's tick size and price scale, so it works on forex, stocks, crypto and indices without manual setup.
*Quarter levels. Between each pair of main levels, the script draws a .25 line, a .50 core line and a .75 line.
*Core line. The .50 line is drawn thicker, in black, with a soft glow, so it stands out as the key level.
*Edge lines. The .25 and .75 lines are drawn in light blue.
Settings
*Graves each side of price: how many levels to show above and below price (up to 60 each side).
*Anchor source: Daily Open (default), Prev Day Close, Weekly Open, Monthly Open, Yearly Open, or Zero for a fixed grid that never resets.
*Line widths and colours for the core and edge lines.
*Price tags: optional labels showing each level's price, with an adjustable distance from the last bar.
版本注释
Fixes and clarificationsFixed
- Levels now land on clean prices. The anchor (daily open etc.) is rounded to the nearest 25 ticks before the grid is built, so levels read like 4148.25 / 4150.75 / 4153.25 instead of 4148.31 / 4150.81.
- Line and label limits. "Graves Each Side of Price" is now capped at what fits TradingView's limits: 37 per side, or 20 per side with price tags on.
Clarifications
- Only the current grid is drawn, on the latest bar. Past days' grids are not kept on history. The grid re-anchors when a new day starts.
- The main round-number levels (.00) are not drawn. Only the .25, .50 and .75 levels between them are.
- The core line is black by default, so change its colour on dark charts.
- Step = tick size x 1000 (x5 on Daily and 4H+, x10 on Weekly/Monthly) x price scale. Levels = rounded anchor + n x step + 0.25 / 0.50 / 0.75 x step.
No change to colours, line widths, price tags or anchor options.
版本注释
v1.1.2 - Header restoredRestored: The license and author header (Mozilla Public License 2.0, © ChartTrader-X) was removed by mistake in an earlier update. It is back in this version.
No change to the code, levels, colours or settings.
开源脚本
秉承TradingView的精神,该脚本的作者将其开源,以便交易者可以查看和验证其功能。向作者致敬!您可以免费使用该脚本,但请记住,重新发布代码须遵守我们的网站规则。

ChartTrader-X
免责声明
这些信息和出版物并非旨在提供,也不构成TradingView提供或认可的任何形式的财务、投资、交易或其他类型的建议或推荐。请阅读使用条款了解更多信息。
开源脚本
秉承TradingView的精神,该脚本的作者将其开源,以便交易者可以查看和验证其功能。向作者致敬!您可以免费使用该脚本,但请记住,重新发布代码须遵守我们的网站规则。
ChartTrader-X
免责声明
这些信息和出版物并非旨在提供,也不构成TradingView提供或认可的任何形式的财务、投资、交易或其他类型的建议或推荐。请阅读使用条款了解更多信息。