OPEN-SOURCE SCRIPT
已更新 RSI Entry Engine
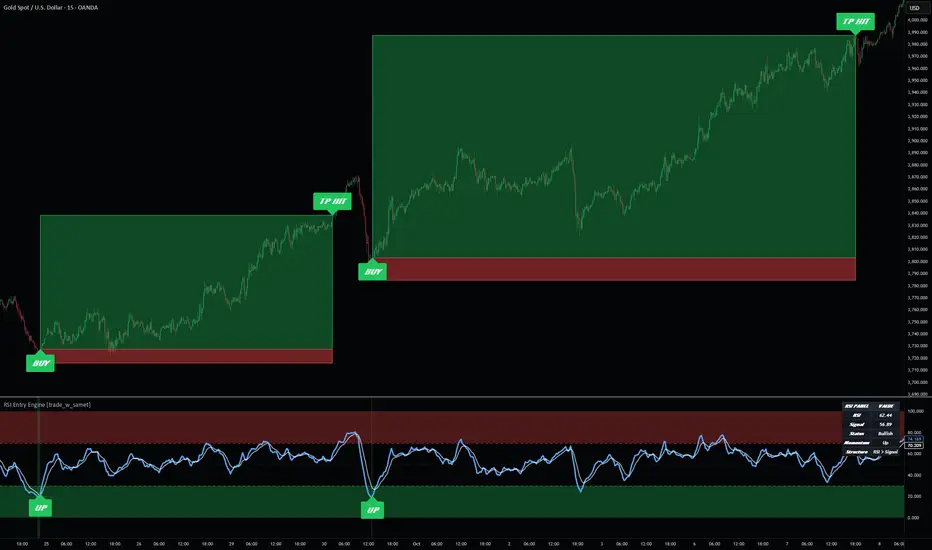
RSI Entry Engine
RSI Entry Engine is an open-source RSI-based entry framework built around one specific analytical idea:
when a smoothed RSI leaves an extreme condition and reclaims back through a defined threshold, that reclaim can be treated as a structured entry event rather than as a generic oscillator fluctuation.
This script is not designed to mark every RSI movement, and it is not intended to behave like a generic “overbought / oversold indicator” that treats all oscillator readings the same way. Its purpose is to smooth RSI behavior, define a hierarchy of RSI states, detect reclaim-style transitions out of extreme zones, and optionally map those reclaim events into a projected risk framework directly on the price chart.
The script also includes a compact status panel and an alert structure so users can monitor RSI condition, internal signal state, and projected trade behavior in a more organized way. These features are included to support analysis and review, not to imply future performance.
OPEN-SOURCE NOTE
This script is published open-source so users can inspect the logic directly, verify what the script is doing, and adapt parts of the workflow for their own research if they wish.
Even though the code is open, this description is intentionally detailed because many TradingView users do not read Pine Script. The goal is for a user to understand what the script does, how it works, why its parts belong together, and how it may be used in practice without having to study the code line by line.
OVERVIEW
At a high level, the script does seven things:
1. It calculates a base RSI from a selected source and length.
2. It optionally smooths that RSI and also derives a separate signal line from the smoothed RSI.
3. It organizes RSI values into multiple zones such as overbought, oversold, extreme high, extreme low, bullish, bearish, and neutral.
4. It detects reclaim-style entry signals when the smoothed RSI exits an extreme condition by crossing back through the selected extreme boundary.
5. It can project entry, stop loss, and take profit structure onto the main chart.
6. It can maintain a compact status panel summarizing RSI state, momentum, and structure.
7. It provides alert conditions for RSI / signal crosses, reclaim events, centerline transitions, and optional trade outcomes.
The script is therefore meant to function as a complete RSI reclaim-entry and review framework rather than as a single-purpose oscillator plot.
CORE IDEA
Many RSI tools are used in one of two broad ways:
- as a visual overbought / oversold reference,
- or as a simple cross-based signal tool.
This script takes a narrower and more structured approach.
Its main idea is that a reclaim out of an extreme zone may be more useful than the extreme reading by itself.
In other words, the script does not assume that simply being overbought or oversold is enough. Instead, it focuses on the transition that occurs when smoothed RSI moves out of a more extreme condition and crosses back through a defined reclaim threshold.
That is the reason the main signal model is based on:
- reclaim above the extreme-low boundary for a bullish entry event,
- reclaim below the extreme-high boundary for a bearish entry event.
This means the script is not centered on “RSI is high” or “RSI is low” alone. It is centered on the moment when a smoothed oscillator moves from extreme positioning into a reclaim state that can be interpreted as a structured shift in short-term momentum.
WHY THIS SCRIPT IS NOT A SIMPLE MASHUP
This script combines several components, but they are not included simply to add more features to one publication.
Each part has a specific role inside the same analytical workflow:
- The RSI engine defines the core oscillator state.
- The smoothing layer reduces noise and makes reclaim logic less reactive to small fluctuations.
- The signal line provides a secondary internal reference for oscillator structure.
- The zone system divides RSI behavior into interpretable states such as neutral, bullish, bearish, oversold, overbought, and extreme conditions.
- The reclaim logic defines the actual entry event.
- The trade projection layer maps that event onto the price chart using entry, stop, and target logic.
- The panel and alerts organize the resulting information for monitoring and review.
These parts are interdependent.
Without RSI calculation, there is no oscillator framework.
Without smoothing, reclaim logic becomes more sensitive to noise.
Without the level structure, reclaim events lose contextual meaning.
Without the reclaim rule, the script becomes a more generic RSI plot.
Without trade projection, the user still has to manually draw entry, stop, and target after each signal.
Without the panel and alerts, the script offers less structure for monitoring and review.
For that reason, the script is intended as a single RSI reclaim-entry framework, not as a random collection of unrelated features.
WHAT THE SCRIPT DOES
The script calculates RSI from a selected source and length, then optionally smooths it using one of several averaging methods.
It also creates a signal line from the smoothed RSI.
Once those two internal series exist, the script can:
- classify RSI state using multiple threshold levels,
- highlight extreme conditions visually,
- detect reclaim signals out of extreme zones,
- plot labels on the RSI pane,
- project BUY / SELL trade structures on the main price chart,
- update TP / SL boxes over time,
- show a compact state panel,
- create alerts for multiple RSI-related events.
This means the script is not just an oscillator display. It is an oscillator-driven entry framework with optional on-chart trade projection.
HOW THE SCRIPT WORKS
1) RSI ENGINE
The script begins with a standard RSI calculation based on a user-selected source and length.
That raw RSI can then be smoothed using one of several methods:
- None,
- EMA,
- SMA,
- RMA.
The smoothed RSI is the main series used for interpretation and signaling.
A second line called the signal line is then derived from the smoothed RSI using its own smoothing method and length.
This creates two internal oscillator references:
- the smoothed RSI itself,
- and a signal line built from that smoothed RSI.
The spread between those two series is also used in the panel to describe whether RSI is currently above or below its signal structure.
2) RSI STATE MODEL
The script does not treat RSI as a single binary oscillator. It organizes RSI values into multiple states:
- Extreme High,
- Overbought,
- Bullish,
- Neutral,
- Bearish,
- Oversold,
- Extreme Low.
These states are determined by the user-defined threshold levels:
- Overbought,
- Oversold,
- Extreme High,
- Extreme Low,
- and the centerline area around 50.
This state model is important because it gives the reclaim signals context. A reclaim signal is not interpreted in isolation; it is interpreted relative to where the smoothed RSI has been and which region it is leaving.
3) LEVEL STRUCTURE
The script plots:
- 0,
- 100,
- 50 centerline,
- Overbought,
- Oversold,
- Extreme High,
- Extreme Low.
It also fills the overbought and oversold regions for easier visual reading, and can optionally highlight the background when RSI is in an extreme condition.
This visual structure is not only cosmetic. It helps the user see why the script treats certain transitions differently from ordinary oscillator movement.
4) PRIMARY ENTRY SIGNAL MODEL
The main entry logic is reclaim-based.
Bullish entry event:
- the smoothed RSI crosses upward through the Extreme Low level,
- and the bar must be confirmed on close.
Bearish entry event:
- the smoothed RSI crosses downward through the Extreme High level,
- and the bar must be confirmed on close.
This means the script does not trigger merely because RSI becomes extreme. Instead, it waits for RSI to transition back through the selected extreme boundary.
That distinction is important.
A low RSI reading alone can persist for multiple bars.
A reclaim above the extreme-low threshold is a different event.
Likewise, a high RSI reading alone can persist,
but a reclaim downward through the extreme-high threshold is a different event.
The script is built around that reclaim event rather than around static RSI position alone.
5) BAR-CLOSE CONFIRMATION
Signals are confirmed only on bar close.
This is an important implementation detail because RSI can move intrabar and then reverse before the bar closes. By requiring confirmation on the close, the script avoids treating temporary intrabar movement as a completed reclaim signal.
This makes the signal model more conservative and more stable.
6) OPTIONAL TRADE PROJECTION
When a valid bullish or bearish reclaim signal appears, the script can optionally project a trade framework onto the main price chart.
This is done even though the script itself is plotted in a separate RSI pane.
Depending on settings, the projection includes:
- entry reference,
- stop-loss calculation,
- take-profit projection,
- TP box,
- SL box,
- entry line,
- BUY or SELL label.
The user can choose the entry reference method:
- Close,
- Open,
- HLC3.
The user can also choose the stop-loss mode:
- Signal Candle,
- ATR,
- Percent.
This means the script separates signal generation from risk projection. The reclaim event comes from RSI behavior, but the projected stop logic can be adapted to different preferences.
7) STOP-LOSS MODES
The script supports three stop-loss methods:
Signal Candle:
The stop is based on the high or low of the signal candle, depending on trade direction.
ATR:
The stop is based on ATR distance from the projected entry.
Percent:
The stop is based on a percentage distance from entry.
This allows the same reclaim signal model to be projected using different risk frameworks without changing the core RSI logic.
8) TAKE-PROFIT PROJECTION
Take profit is projected using a risk/reward multiple applied to the chosen stop distance.
This means the target is not arbitrary. It is derived from the actual stop distance created by the selected stop-loss mode and then multiplied by the chosen RR value.
This makes the trade projection internally consistent:
signal
→ entry method
→ stop-loss method
→ risk distance
→ take-profit distance.
9) SAME-BAR TP / SL PRIORITY
The script includes an explicit rule for bars where both TP and SL appear to be touched after entry.
The user can choose whether the same-bar priority should be:
- SL,
- or TP.
This is an important implementation detail because it affects projected review behavior. Without an explicit priority rule, same-bar ambiguity can produce inconsistent outcome interpretation.
10) TRADE BOX MAINTENANCE
The script stores projected trades internally and extends TP / SL boxes and entry lines forward as long as the trade remains active.
It also limits how many historical projected trades remain visible by using a maximum stored trade setting. This keeps the chart more manageable and prevents the projection layer from expanding indefinitely.
11) STATUS PANEL
The script includes a compact panel that can display:
- the current RSI value,
- the signal-line value,
- the current RSI state,
- short-term momentum direction based on RSI change,
- whether RSI is above or below its signal line.
This panel is designed to summarize the oscillator’s state without requiring the user to read every value directly from the plot.
12) ALERT STRUCTURE
The script can generate alerts for several types of events:
- RSI crossing above its signal line,
- RSI crossing below its signal line,
- RSI reclaiming above oversold,
- RSI rejecting below overbought,
- RSI crossing above the centerline,
- RSI crossing below the centerline,
- bullish reclaim entry signal,
- bearish reclaim entry signal,
- projected TP hit,
- projected SL hit.
This allows the script to be used either visually or as an alert-based monitoring tool.
WHAT MAKES THIS SCRIPT ORIGINAL
This script uses familiar technical-analysis building blocks such as:
- RSI,
- smoothing methods,
- threshold zones,
- ATR-based risk projection,
- percentage-based stops,
- RR-based targets,
- on-chart annotation.
Those building blocks are not original by themselves.
The originality of this script is not in inventing a completely new oscillator primitive. The originality lies in how those familiar elements are arranged into one structured RSI reclaim workflow:
RSI calculation
→ smoothing
→ signal-line derivation
→ multi-zone RSI state model
→ reclaim detection out of extreme conditions
→ optional on-chart trade projection
→ panel-based monitoring
→ alert and review behavior
That full sequence is the main reason this script exists as its own publication.
It is not intended to be simply another RSI plot, another overbought / oversold overlay, another signal-line cross tool, or another TP / SL box script. It is specifically an RSI reclaim-entry framework that combines oscillator conditioning, reclaim detection, projection, and monitoring in one workflow.
WHAT APPEARS ON THE CHART
Depending on settings, the script may display in the RSI pane:
- smoothed RSI,
- the signal line,
- 0 / 100 bounds,
- centerline,
- overbought and oversold levels,
- extreme-high and extreme-low levels,
- overbought / oversold zone fill,
- optional extreme background highlights,
- UP / DOWN labels,
- a status panel.
On the main price chart, it may also display:
- BUY / SELL labels,
- entry line,
- TP box,
- SL box,
- TP hit labels,
- SL hit labels.
This split design is intentional. RSI analysis remains in the oscillator pane, while projected execution structure appears on the price chart.
HOW TO USE THE SCRIPT
A practical workflow is:
1. Add the script to a chart and choose the RSI source and RSI length.
2. Select whether the RSI should remain raw or be smoothed.
3. Configure the signal line used for internal oscillator structure.
4. Set the overbought, oversold, extreme-high, and extreme-low thresholds.
5. Decide whether you want trade projection on the main chart.
6. Choose entry mode, stop-loss mode, and risk/reward multiple.
7. Wait for a bullish or bearish reclaim signal to be confirmed on bar close.
8. Use the projected trade structure as an analysis framework rather than as a blind instruction.
9. Use the panel and alerts to monitor RSI state and signal transitions.
10. Adjust settings only after reviewing how the same logic behaves across the symbols and timeframes you actually use.
This script is best understood as a structured decision-support and review tool, not as a self-sufficient automated trading system.
SETTINGS REFERENCE
RSI Engine
- RSI Source: input source used for RSI calculation.
- RSI Length: length of the base RSI.
- RSI Smoothing: smoothing method applied to raw RSI.
- Smoothing Length: length of the first smoothing stage.
- Signal Length: length of the signal line.
- Signal Smoothing: smoothing method used for the signal line.
Zones
- Overbought: upper reference threshold.
- Oversold: lower reference threshold.
- Extreme High: upper extreme reclaim boundary.
- Extreme Low: lower extreme reclaim boundary.
Visuals
- Highlight Extreme Background: highlights the panel background during extreme conditions.
- Show Status Panel: enables or disables the panel.
- Panel Position: controls panel location.
- Panel Text Size: controls panel text size.
Trade Engine
- Show TP / SL Boxes On Main Chart: enables or disables price-chart projection.
- Entry Price: selects the projected entry reference.
- Stop Loss Mode: selects how stop loss is calculated.
- Risk Reward: sets the take-profit multiple.
- ATR Length: ATR length used when ATR stop mode is selected.
- ATR Multiplier: ATR multiplier used for ATR stop mode.
- Percent Stop Loss: percentage stop value used in Percent mode.
- Same Bar TP/SL Priority: defines which outcome wins when both are touched on one bar.
- Max Stored Trade Boxes: limits how many projected historical trades remain visible.
Alerts
- Enable RSI / Signal Cross Alerts: alerts for oscillator / signal crosses.
- Enable OB / OS Reclaim Alerts: alerts for reclaim behavior around overbought / oversold.
- Enable Centerline Alerts: alerts for 50-line crosses.
- Enable Entry Signal Alerts: alerts for bullish and bearish reclaim entries.
- Enable TP / SL Hit Alerts: alerts for projected trade outcomes.
IMPORTANT PRACTICAL NOTES
This script depends heavily on the chosen RSI thresholds.
If thresholds are too wide, signals may become very rare.
If thresholds are too narrow, signals may become too frequent.
Signal quality and frequency will also change depending on:
- RSI length,
- smoothing method,
- signal-line length,
- timeframe,
- symbol volatility,
- stop-loss mode.
Because trade projection is built from RSI events rather than from direct price-structure analysis, the projected boxes should be understood as a standardized review layer, not as proof that the market itself respects those projected levels.
LIMITATIONS AND SHORTCOMINGS
This script has important limitations:
- It is an oscillator-based reclaim model, not a full market-structure system.
- It does not identify support and resistance or discretionary chart structure.
- It does not claim that all extreme RSI conditions will reverse.
- It does not use volume profile, order flow, or trend structure beyond the oscillator model itself.
- Its signals depend on smoothing choices and threshold definitions.
- Projected TP / SL outcomes depend on the chosen entry and stop-loss method.
- Same-bar ambiguity is handled by a rule, not by true intrabar reconstruction.
- Historical projected trade behavior should not be interpreted as guaranteed live performance.
- No RSI-based reclaim model can remove all false signals or all regime-dependent behavior.
For those reasons, the script should be used as a structured analysis and review framework, not as a promise of future profitability.
WHO THIS SCRIPT MAY BE USEFUL FOR
This script may be useful for traders who:
- use RSI as a state and transition tool rather than as a static threshold indicator,
- care about reclaim behavior out of extreme zones,
- want optional projected risk structure on the price chart,
- want a compact RSI-state panel,
- want alert-based monitoring of oscillator events.
It may be less suitable for traders who:
- want a pure trend-following tool,
- want structural support / resistance logic,
- want a complete strategy with no need for outside confirmation,
- want projected trade statistics to be treated as live-execution evidence.
DISCLAIMER
This script is provided for educational and informational purposes only.
It does not constitute financial, investment, or trading advice.
Market conditions change, historical behavior does not guarantee future results, and users should perform their own analysis, validation, and risk management before using the script in live decision-making.
RSI Entry Engine is an open-source RSI-based entry framework built around one specific analytical idea:
when a smoothed RSI leaves an extreme condition and reclaims back through a defined threshold, that reclaim can be treated as a structured entry event rather than as a generic oscillator fluctuation.
This script is not designed to mark every RSI movement, and it is not intended to behave like a generic “overbought / oversold indicator” that treats all oscillator readings the same way. Its purpose is to smooth RSI behavior, define a hierarchy of RSI states, detect reclaim-style transitions out of extreme zones, and optionally map those reclaim events into a projected risk framework directly on the price chart.
The script also includes a compact status panel and an alert structure so users can monitor RSI condition, internal signal state, and projected trade behavior in a more organized way. These features are included to support analysis and review, not to imply future performance.
OPEN-SOURCE NOTE
This script is published open-source so users can inspect the logic directly, verify what the script is doing, and adapt parts of the workflow for their own research if they wish.
Even though the code is open, this description is intentionally detailed because many TradingView users do not read Pine Script. The goal is for a user to understand what the script does, how it works, why its parts belong together, and how it may be used in practice without having to study the code line by line.
OVERVIEW
At a high level, the script does seven things:
1. It calculates a base RSI from a selected source and length.
2. It optionally smooths that RSI and also derives a separate signal line from the smoothed RSI.
3. It organizes RSI values into multiple zones such as overbought, oversold, extreme high, extreme low, bullish, bearish, and neutral.
4. It detects reclaim-style entry signals when the smoothed RSI exits an extreme condition by crossing back through the selected extreme boundary.
5. It can project entry, stop loss, and take profit structure onto the main chart.
6. It can maintain a compact status panel summarizing RSI state, momentum, and structure.
7. It provides alert conditions for RSI / signal crosses, reclaim events, centerline transitions, and optional trade outcomes.
The script is therefore meant to function as a complete RSI reclaim-entry and review framework rather than as a single-purpose oscillator plot.
CORE IDEA
Many RSI tools are used in one of two broad ways:
- as a visual overbought / oversold reference,
- or as a simple cross-based signal tool.
This script takes a narrower and more structured approach.
Its main idea is that a reclaim out of an extreme zone may be more useful than the extreme reading by itself.
In other words, the script does not assume that simply being overbought or oversold is enough. Instead, it focuses on the transition that occurs when smoothed RSI moves out of a more extreme condition and crosses back through a defined reclaim threshold.
That is the reason the main signal model is based on:
- reclaim above the extreme-low boundary for a bullish entry event,
- reclaim below the extreme-high boundary for a bearish entry event.
This means the script is not centered on “RSI is high” or “RSI is low” alone. It is centered on the moment when a smoothed oscillator moves from extreme positioning into a reclaim state that can be interpreted as a structured shift in short-term momentum.
WHY THIS SCRIPT IS NOT A SIMPLE MASHUP
This script combines several components, but they are not included simply to add more features to one publication.
Each part has a specific role inside the same analytical workflow:
- The RSI engine defines the core oscillator state.
- The smoothing layer reduces noise and makes reclaim logic less reactive to small fluctuations.
- The signal line provides a secondary internal reference for oscillator structure.
- The zone system divides RSI behavior into interpretable states such as neutral, bullish, bearish, oversold, overbought, and extreme conditions.
- The reclaim logic defines the actual entry event.
- The trade projection layer maps that event onto the price chart using entry, stop, and target logic.
- The panel and alerts organize the resulting information for monitoring and review.
These parts are interdependent.
Without RSI calculation, there is no oscillator framework.
Without smoothing, reclaim logic becomes more sensitive to noise.
Without the level structure, reclaim events lose contextual meaning.
Without the reclaim rule, the script becomes a more generic RSI plot.
Without trade projection, the user still has to manually draw entry, stop, and target after each signal.
Without the panel and alerts, the script offers less structure for monitoring and review.
For that reason, the script is intended as a single RSI reclaim-entry framework, not as a random collection of unrelated features.
WHAT THE SCRIPT DOES
The script calculates RSI from a selected source and length, then optionally smooths it using one of several averaging methods.
It also creates a signal line from the smoothed RSI.
Once those two internal series exist, the script can:
- classify RSI state using multiple threshold levels,
- highlight extreme conditions visually,
- detect reclaim signals out of extreme zones,
- plot labels on the RSI pane,
- project BUY / SELL trade structures on the main price chart,
- update TP / SL boxes over time,
- show a compact state panel,
- create alerts for multiple RSI-related events.
This means the script is not just an oscillator display. It is an oscillator-driven entry framework with optional on-chart trade projection.
HOW THE SCRIPT WORKS
1) RSI ENGINE
The script begins with a standard RSI calculation based on a user-selected source and length.
That raw RSI can then be smoothed using one of several methods:
- None,
- EMA,
- SMA,
- RMA.
The smoothed RSI is the main series used for interpretation and signaling.
A second line called the signal line is then derived from the smoothed RSI using its own smoothing method and length.
This creates two internal oscillator references:
- the smoothed RSI itself,
- and a signal line built from that smoothed RSI.
The spread between those two series is also used in the panel to describe whether RSI is currently above or below its signal structure.
2) RSI STATE MODEL
The script does not treat RSI as a single binary oscillator. It organizes RSI values into multiple states:
- Extreme High,
- Overbought,
- Bullish,
- Neutral,
- Bearish,
- Oversold,
- Extreme Low.
These states are determined by the user-defined threshold levels:
- Overbought,
- Oversold,
- Extreme High,
- Extreme Low,
- and the centerline area around 50.
This state model is important because it gives the reclaim signals context. A reclaim signal is not interpreted in isolation; it is interpreted relative to where the smoothed RSI has been and which region it is leaving.
3) LEVEL STRUCTURE
The script plots:
- 0,
- 100,
- 50 centerline,
- Overbought,
- Oversold,
- Extreme High,
- Extreme Low.
It also fills the overbought and oversold regions for easier visual reading, and can optionally highlight the background when RSI is in an extreme condition.
This visual structure is not only cosmetic. It helps the user see why the script treats certain transitions differently from ordinary oscillator movement.
4) PRIMARY ENTRY SIGNAL MODEL
The main entry logic is reclaim-based.
Bullish entry event:
- the smoothed RSI crosses upward through the Extreme Low level,
- and the bar must be confirmed on close.
Bearish entry event:
- the smoothed RSI crosses downward through the Extreme High level,
- and the bar must be confirmed on close.
This means the script does not trigger merely because RSI becomes extreme. Instead, it waits for RSI to transition back through the selected extreme boundary.
That distinction is important.
A low RSI reading alone can persist for multiple bars.
A reclaim above the extreme-low threshold is a different event.
Likewise, a high RSI reading alone can persist,
but a reclaim downward through the extreme-high threshold is a different event.
The script is built around that reclaim event rather than around static RSI position alone.
5) BAR-CLOSE CONFIRMATION
Signals are confirmed only on bar close.
This is an important implementation detail because RSI can move intrabar and then reverse before the bar closes. By requiring confirmation on the close, the script avoids treating temporary intrabar movement as a completed reclaim signal.
This makes the signal model more conservative and more stable.
6) OPTIONAL TRADE PROJECTION
When a valid bullish or bearish reclaim signal appears, the script can optionally project a trade framework onto the main price chart.
This is done even though the script itself is plotted in a separate RSI pane.
Depending on settings, the projection includes:
- entry reference,
- stop-loss calculation,
- take-profit projection,
- TP box,
- SL box,
- entry line,
- BUY or SELL label.
The user can choose the entry reference method:
- Close,
- Open,
- HLC3.
The user can also choose the stop-loss mode:
- Signal Candle,
- ATR,
- Percent.
This means the script separates signal generation from risk projection. The reclaim event comes from RSI behavior, but the projected stop logic can be adapted to different preferences.
7) STOP-LOSS MODES
The script supports three stop-loss methods:
Signal Candle:
The stop is based on the high or low of the signal candle, depending on trade direction.
ATR:
The stop is based on ATR distance from the projected entry.
Percent:
The stop is based on a percentage distance from entry.
This allows the same reclaim signal model to be projected using different risk frameworks without changing the core RSI logic.
8) TAKE-PROFIT PROJECTION
Take profit is projected using a risk/reward multiple applied to the chosen stop distance.
This means the target is not arbitrary. It is derived from the actual stop distance created by the selected stop-loss mode and then multiplied by the chosen RR value.
This makes the trade projection internally consistent:
signal
→ entry method
→ stop-loss method
→ risk distance
→ take-profit distance.
9) SAME-BAR TP / SL PRIORITY
The script includes an explicit rule for bars where both TP and SL appear to be touched after entry.
The user can choose whether the same-bar priority should be:
- SL,
- or TP.
This is an important implementation detail because it affects projected review behavior. Without an explicit priority rule, same-bar ambiguity can produce inconsistent outcome interpretation.
10) TRADE BOX MAINTENANCE
The script stores projected trades internally and extends TP / SL boxes and entry lines forward as long as the trade remains active.
It also limits how many historical projected trades remain visible by using a maximum stored trade setting. This keeps the chart more manageable and prevents the projection layer from expanding indefinitely.
11) STATUS PANEL
The script includes a compact panel that can display:
- the current RSI value,
- the signal-line value,
- the current RSI state,
- short-term momentum direction based on RSI change,
- whether RSI is above or below its signal line.
This panel is designed to summarize the oscillator’s state without requiring the user to read every value directly from the plot.
12) ALERT STRUCTURE
The script can generate alerts for several types of events:
- RSI crossing above its signal line,
- RSI crossing below its signal line,
- RSI reclaiming above oversold,
- RSI rejecting below overbought,
- RSI crossing above the centerline,
- RSI crossing below the centerline,
- bullish reclaim entry signal,
- bearish reclaim entry signal,
- projected TP hit,
- projected SL hit.
This allows the script to be used either visually or as an alert-based monitoring tool.
WHAT MAKES THIS SCRIPT ORIGINAL
This script uses familiar technical-analysis building blocks such as:
- RSI,
- smoothing methods,
- threshold zones,
- ATR-based risk projection,
- percentage-based stops,
- RR-based targets,
- on-chart annotation.
Those building blocks are not original by themselves.
The originality of this script is not in inventing a completely new oscillator primitive. The originality lies in how those familiar elements are arranged into one structured RSI reclaim workflow:
RSI calculation
→ smoothing
→ signal-line derivation
→ multi-zone RSI state model
→ reclaim detection out of extreme conditions
→ optional on-chart trade projection
→ panel-based monitoring
→ alert and review behavior
That full sequence is the main reason this script exists as its own publication.
It is not intended to be simply another RSI plot, another overbought / oversold overlay, another signal-line cross tool, or another TP / SL box script. It is specifically an RSI reclaim-entry framework that combines oscillator conditioning, reclaim detection, projection, and monitoring in one workflow.
WHAT APPEARS ON THE CHART
Depending on settings, the script may display in the RSI pane:
- smoothed RSI,
- the signal line,
- 0 / 100 bounds,
- centerline,
- overbought and oversold levels,
- extreme-high and extreme-low levels,
- overbought / oversold zone fill,
- optional extreme background highlights,
- UP / DOWN labels,
- a status panel.
On the main price chart, it may also display:
- BUY / SELL labels,
- entry line,
- TP box,
- SL box,
- TP hit labels,
- SL hit labels.
This split design is intentional. RSI analysis remains in the oscillator pane, while projected execution structure appears on the price chart.
HOW TO USE THE SCRIPT
A practical workflow is:
1. Add the script to a chart and choose the RSI source and RSI length.
2. Select whether the RSI should remain raw or be smoothed.
3. Configure the signal line used for internal oscillator structure.
4. Set the overbought, oversold, extreme-high, and extreme-low thresholds.
5. Decide whether you want trade projection on the main chart.
6. Choose entry mode, stop-loss mode, and risk/reward multiple.
7. Wait for a bullish or bearish reclaim signal to be confirmed on bar close.
8. Use the projected trade structure as an analysis framework rather than as a blind instruction.
9. Use the panel and alerts to monitor RSI state and signal transitions.
10. Adjust settings only after reviewing how the same logic behaves across the symbols and timeframes you actually use.
This script is best understood as a structured decision-support and review tool, not as a self-sufficient automated trading system.
SETTINGS REFERENCE
RSI Engine
- RSI Source: input source used for RSI calculation.
- RSI Length: length of the base RSI.
- RSI Smoothing: smoothing method applied to raw RSI.
- Smoothing Length: length of the first smoothing stage.
- Signal Length: length of the signal line.
- Signal Smoothing: smoothing method used for the signal line.
Zones
- Overbought: upper reference threshold.
- Oversold: lower reference threshold.
- Extreme High: upper extreme reclaim boundary.
- Extreme Low: lower extreme reclaim boundary.
Visuals
- Highlight Extreme Background: highlights the panel background during extreme conditions.
- Show Status Panel: enables or disables the panel.
- Panel Position: controls panel location.
- Panel Text Size: controls panel text size.
Trade Engine
- Show TP / SL Boxes On Main Chart: enables or disables price-chart projection.
- Entry Price: selects the projected entry reference.
- Stop Loss Mode: selects how stop loss is calculated.
- Risk Reward: sets the take-profit multiple.
- ATR Length: ATR length used when ATR stop mode is selected.
- ATR Multiplier: ATR multiplier used for ATR stop mode.
- Percent Stop Loss: percentage stop value used in Percent mode.
- Same Bar TP/SL Priority: defines which outcome wins when both are touched on one bar.
- Max Stored Trade Boxes: limits how many projected historical trades remain visible.
Alerts
- Enable RSI / Signal Cross Alerts: alerts for oscillator / signal crosses.
- Enable OB / OS Reclaim Alerts: alerts for reclaim behavior around overbought / oversold.
- Enable Centerline Alerts: alerts for 50-line crosses.
- Enable Entry Signal Alerts: alerts for bullish and bearish reclaim entries.
- Enable TP / SL Hit Alerts: alerts for projected trade outcomes.
IMPORTANT PRACTICAL NOTES
This script depends heavily on the chosen RSI thresholds.
If thresholds are too wide, signals may become very rare.
If thresholds are too narrow, signals may become too frequent.
Signal quality and frequency will also change depending on:
- RSI length,
- smoothing method,
- signal-line length,
- timeframe,
- symbol volatility,
- stop-loss mode.
Because trade projection is built from RSI events rather than from direct price-structure analysis, the projected boxes should be understood as a standardized review layer, not as proof that the market itself respects those projected levels.
LIMITATIONS AND SHORTCOMINGS
This script has important limitations:
- It is an oscillator-based reclaim model, not a full market-structure system.
- It does not identify support and resistance or discretionary chart structure.
- It does not claim that all extreme RSI conditions will reverse.
- It does not use volume profile, order flow, or trend structure beyond the oscillator model itself.
- Its signals depend on smoothing choices and threshold definitions.
- Projected TP / SL outcomes depend on the chosen entry and stop-loss method.
- Same-bar ambiguity is handled by a rule, not by true intrabar reconstruction.
- Historical projected trade behavior should not be interpreted as guaranteed live performance.
- No RSI-based reclaim model can remove all false signals or all regime-dependent behavior.
For those reasons, the script should be used as a structured analysis and review framework, not as a promise of future profitability.
WHO THIS SCRIPT MAY BE USEFUL FOR
This script may be useful for traders who:
- use RSI as a state and transition tool rather than as a static threshold indicator,
- care about reclaim behavior out of extreme zones,
- want optional projected risk structure on the price chart,
- want a compact RSI-state panel,
- want alert-based monitoring of oscillator events.
It may be less suitable for traders who:
- want a pure trend-following tool,
- want structural support / resistance logic,
- want a complete strategy with no need for outside confirmation,
- want projected trade statistics to be treated as live-execution evidence.
DISCLAIMER
This script is provided for educational and informational purposes only.
It does not constitute financial, investment, or trading advice.
Market conditions change, historical behavior does not guarantee future results, and users should perform their own analysis, validation, and risk management before using the script in live decision-making.
版本注释
━━━━━━━━━━━━━━━━━━━━━━🆕 UPDATE — RSI Entry Engine [trade_w_samet]
━━━━━━━━━━━━━━━━━━━━━━
RSI Entry Engine [trade_w_samet] has been updated with a cleaner visual structure, improved chart labels, better settings clarity, and a more professional user experience.
This update does not change the core RSI signal concept.
The main logic still focuses on smoothed RSI behavior, extreme-zone reclaim / rejection signals, optional TP/SL projection boxes, and a compact RSI status panel.
The purpose of this update is to make the indicator easier to read, easier to configure, and more transparent directly on the chart.
━━━━━━━━━━━━━━━━━━━━━━
✅ What Changed In This Update?
━━━━━━━━━━━━━━━━━━━━━━
• The full script name was updated to:
RSI Entry Engine [trade_w_samet]
• The short title was also updated to the same name for consistent branding.
• Emoji-based input groups and setting names were added.
• All input values are now hidden from the TradingView status line for a cleaner chart header.
• Detailed tooltips were added to the settings menu.
• Chart label tooltips were added to explain RSI signals, projected trade labels, TP hits, and SL hits.
• All main chart labels now use white text for better visibility.
• Chart labels were upgraded with bold + italic formatting.
• Unicode-styled bold/italic label text was added to make labels visually stronger.
• A new label size setting was added.
• Users can now adjust the size of UP, DOWN, BUY, SELL, TP HIT, and SL HIT labels from the settings.
• The RSI panel text was also visually improved with cleaner white text and stronger formatting.
━━━━━━━━━━━━━━━━━━━━━━
🏷️ New Label Size Setting
━━━━━━━━━━━━━━━━━━━━━━
A new label size input was added under the visual settings.
This allows users to control how large the chart labels appear.
Available options:
• Tiny
• Small
• Normal
• Large
• Huge
Example:
This gives users more control over chart readability depending on screen size, symbol, and layout preference.
━━━━━━━━━━━━━━━━━━━━━━
🎨 White Bold + Italic Chart Labels
━━━━━━━━━━━━━━━━━━━━━━
The chart labels were updated to use white text and stronger formatting.
Because text rendering may vary depending on TradingView, browser, operating system, and font support, the update uses two layers:
• Pine Script text formatting
• Unicode-styled bold/italic label text
Example:
This makes the labels visually stronger and easier to notice on the chart.
━━━━━━━━━━━━━━━━━━━━━━
💬 Improved Chart Tooltips
━━━━━━━━━━━━━━━━━━━━━━
Tooltips were added to the chart labels so users can understand the reason behind each visual element.
For example, the projected BUY label now shows:
• Entry price
• Stop-loss price
• Take-profit price
• Risk / Reward value
• Selected SL mode
• Signal context
Example:
This helps users understand the trade projection directly from the chart without needing to guess what the label means.
━━━━━━━━━━━━━━━━━━━━━━
🧼 Cleaner Status Line
━━━━━━━━━━━━━━━━━━━━━━
All major inputs now use:
This keeps the TradingView status line clean and prevents the chart header from becoming crowded with settings values.
The goal is to keep the chart visually focused on the RSI engine, signal labels, TP/SL projections, and the status panel.
━━━━━━━━━━━━━━━━━━━━━━
🧠 Core Signal Logic
━━━━━━━━━━━━━━━━━━━━━━
The main RSI signal logic remains based on confirmed bar-close behavior.
A bullish signal appears when the smoothed RSI reclaims the Extreme Low level.
A bearish signal appears when the smoothed RSI rejects back below the Extreme High level.
Example:
This means the main UP / DOWN signals are confirmed only after the candle closes.
━━━━━━━━━━━━━━━━━━━━━━
📊 Trade Projection Notes
━━━━━━━━━━━━━━━━━━━━━━
The TP / SL boxes are visual projections based on the confirmed RSI signal and selected risk model.
They are not automated trades.
They are not guaranteed outcomes.
They are designed to help users study possible risk / reward structure after a confirmed RSI signal.
The stop-loss can be calculated by:
• Signal Candle
• ATR
• Percent
The take-profit is calculated from the selected Risk / Reward value.
━━━━━━━━━━━━━━━━━━━━━━
⚖️ Same-Bar TP / SL Handling
━━━━━━━━━━━━━━━━━━━━━━
If TP and SL are both touched on the same candle, the selected same-bar priority setting is used.
Example:
This gives users control over how same-candle TP / SL situations are handled in the projection model.
━━━━━━━━━━━━━━━━━━━━━━
🔔 Alerts
━━━━━━━━━━━━━━━━━━━━━━
The alert system remains available for:
• RSI / Signal crosses
• Overbought / Oversold reclaim behavior
• Centerline crosses
• Confirmed entry signals
• Projected TP / SL hits
Users can enable or disable each alert group from the settings.
━━━━━━━━━━━━━━━━━━━━━━
⚠️ Important Risk Disclosure
━━━━━━━━━━━━━━━━━━━━━━
RSI Entry Engine [trade_w_samet] is designed for chart analysis, educational use, and structured RSI-based market study.
It is not financial advice.
It is not a trading bot.
It does not execute trades.
It does not guarantee profitable results.
All signals should be reviewed together with market structure, trend context, liquidity, volatility, and personal risk management.
━━━━━━━━━━━━━━━━━━━━━━
✅ Best Use Case
━━━━━━━━━━━━━━━━━━━━━━
RSI Entry Engine [trade_w_samet] is best used as a clean RSI-based confirmation and study tool for traders who want to analyze:
• Extreme RSI reclaim behavior
• Overbought / oversold reactions
• RSI momentum shifts
• Smoothed RSI and signal-line interaction
• Visual TP / SL projection structure
• Bar-close confirmed signal behavior
This update improves readability, transparency, and user control while keeping the original RSI signal concept intact.
开源脚本
秉承TradingView的精神,该脚本的作者将其开源,以便交易者可以查看和验证其功能。向作者致敬!您可以免费使用该脚本,但请记住,重新发布代码须遵守我们的网站规则。

🎯 | Free & PRO+ trading tools 📈
tradewsamet.com
discord.com/invite/WeunuuvjBG
tradewsamet.com
discord.com/invite/WeunuuvjBG
免责声明
这些信息和出版物并非旨在提供,也不构成TradingView提供或认可的任何形式的财务、投资、交易或其他类型的建议或推荐。请阅读使用条款了解更多信息。
开源脚本
秉承TradingView的精神,该脚本的作者将其开源,以便交易者可以查看和验证其功能。向作者致敬!您可以免费使用该脚本,但请记住,重新发布代码须遵守我们的网站规则。
🎯 | Free & PRO+ trading tools 📈
tradewsamet.com
discord.com/invite/WeunuuvjBG
tradewsamet.com
discord.com/invite/WeunuuvjBG
免责声明
这些信息和出版物并非旨在提供,也不构成TradingView提供或认可的任何形式的财务、投资、交易或其他类型的建议或推荐。请阅读使用条款了解更多信息。