OPEN-SOURCE SCRIPT
已更新 NQ Reversal BG Ultra Faded STM F
## ⚠️ DISCLAIMER
This indicator is for educational and informational use only. It does not provide financial advice. Trading futures and leveraged instruments carries significant risk, including potential loss of capital. Users are fully responsible for their trading decisions and risk management.
---
## 🧠 Overview
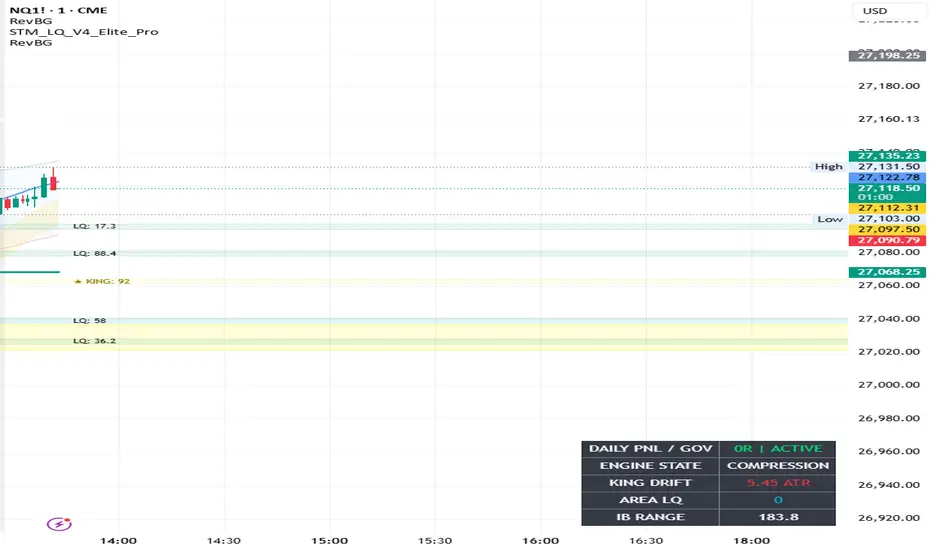
**NQ Reversal BG Ultra Faded STM** is a precision timing overlay that highlights key **intraday reversal windows** where market behavior historically shifts in liquidity and volatility.
Rather than generating trade signals, this tool focuses on:
* ⏱️ Time-based market structure awareness
* 🌊 Liquidity expansion & contraction cycles
* 🔁 Intraday reversal probability zones
* 🧠 Behavioral session mapping
The indicator uses ultra-faded visual backgrounds to keep charts clean while still marking **high-impact timing clusters**.
---
## ⏰ Core Concept
Markets do not move randomly — they move in **time clusters**.
This tool highlights key windows where:
* Institutional participation increases or decreases
* Liquidity is injected or withdrawn
* Short-term reversals are statistically more likely
* Intraday trend shifts often originate
Each highlighted time zone acts as a **context layer**, not a signal.
---
## 📊 Key Time Windows Covered
The indicator marks the following NY time zones:
* 3:00 AM – Early liquidity positioning
* 4:00 AM – London expansion continuation
* 6:00 AM – Pre-New York buildup phase
* 8:00 AM – Institutional pre-market positioning
* 9:45 AM – Post-open rotation zone
* 10:30 AM – First major intraday shift window
* 11:30 AM – Midday exhaustion / continuation test
* 1:30 PM – Afternoon liquidity repositioning
* 2:00 PM – Late-session structural shift window
Each zone is displayed with a **soft fade background** to maintain chart clarity while preserving awareness.
---
## 🎯 Strategy Purpose
This tool is designed to help traders identify:
* 📍 When NOT to trade (low probability chop zones)
* 📍 When volatility is likely to expand or reverse
* 📍 When institutional flow typically repositions
* 📍 Where intraday reversals often cluster
It is best used as a **context filter layered over price action systems** such as:
* SMC / Liquidity models
* VWAP-based strategies
* Breakout & reversal systems
* Order flow confirmation setups
---
## 🧪 Visual Philosophy
Unlike signal-heavy indicators, this system is intentionally minimal:
* Ultra-faded backgrounds (non-intrusive)
* Clean time-based labeling
* No repainting signals or predictive arrows
* Pure structural timing awareness
The goal is **chart clarity + behavioral timing insight**, not noise.
---
## 🧠 How Traders Use It
Common applications include:
* Avoiding entries during low-quality time windows
* Waiting for high-probability reversal periods
* Aligning setups with liquidity expansion phases
* Timing entries around institutional rotation periods
---
## ⚡ Final Note
This indicator is built around a simple edge:
> **“Time is a structural variable in price movement.”**
Understanding *when* price is most reactive is often more powerful than predicting *direction*.
---
This indicator is for educational and informational use only. It does not provide financial advice. Trading futures and leveraged instruments carries significant risk, including potential loss of capital. Users are fully responsible for their trading decisions and risk management.
---
## 🧠 Overview
**NQ Reversal BG Ultra Faded STM** is a precision timing overlay that highlights key **intraday reversal windows** where market behavior historically shifts in liquidity and volatility.
Rather than generating trade signals, this tool focuses on:
* ⏱️ Time-based market structure awareness
* 🌊 Liquidity expansion & contraction cycles
* 🔁 Intraday reversal probability zones
* 🧠 Behavioral session mapping
The indicator uses ultra-faded visual backgrounds to keep charts clean while still marking **high-impact timing clusters**.
---
## ⏰ Core Concept
Markets do not move randomly — they move in **time clusters**.
This tool highlights key windows where:
* Institutional participation increases or decreases
* Liquidity is injected or withdrawn
* Short-term reversals are statistically more likely
* Intraday trend shifts often originate
Each highlighted time zone acts as a **context layer**, not a signal.
---
## 📊 Key Time Windows Covered
The indicator marks the following NY time zones:
* 3:00 AM – Early liquidity positioning
* 4:00 AM – London expansion continuation
* 6:00 AM – Pre-New York buildup phase
* 8:00 AM – Institutional pre-market positioning
* 9:45 AM – Post-open rotation zone
* 10:30 AM – First major intraday shift window
* 11:30 AM – Midday exhaustion / continuation test
* 1:30 PM – Afternoon liquidity repositioning
* 2:00 PM – Late-session structural shift window
Each zone is displayed with a **soft fade background** to maintain chart clarity while preserving awareness.
---
## 🎯 Strategy Purpose
This tool is designed to help traders identify:
* 📍 When NOT to trade (low probability chop zones)
* 📍 When volatility is likely to expand or reverse
* 📍 When institutional flow typically repositions
* 📍 Where intraday reversals often cluster
It is best used as a **context filter layered over price action systems** such as:
* SMC / Liquidity models
* VWAP-based strategies
* Breakout & reversal systems
* Order flow confirmation setups
---
## 🧪 Visual Philosophy
Unlike signal-heavy indicators, this system is intentionally minimal:
* Ultra-faded backgrounds (non-intrusive)
* Clean time-based labeling
* No repainting signals or predictive arrows
* Pure structural timing awareness
The goal is **chart clarity + behavioral timing insight**, not noise.
---
## 🧠 How Traders Use It
Common applications include:
* Avoiding entries during low-quality time windows
* Waiting for high-probability reversal periods
* Aligning setups with liquidity expansion phases
* Timing entries around institutional rotation periods
---
## ⚡ Final Note
This indicator is built around a simple edge:
> **“Time is a structural variable in price movement.”**
Understanding *when* price is most reactive is often more powerful than predicting *direction*.
---
版本注释
Removes time tabs in shaded zone for a cleaner look.开源脚本
秉承TradingView的精神,该脚本的作者将其开源,以便交易者可以查看和验证其功能。向作者致敬!您可以免费使用该脚本,但请记住,重新发布代码须遵守我们的网站规则。

免责声明
这些信息和出版物并非旨在提供,也不构成TradingView提供或认可的任何形式的财务、投资、交易或其他类型的建议或推荐。请阅读使用条款了解更多信息。
开源脚本
秉承TradingView的精神,该脚本的作者将其开源,以便交易者可以查看和验证其功能。向作者致敬!您可以免费使用该脚本,但请记住,重新发布代码须遵守我们的网站规则。
免责声明
这些信息和出版物并非旨在提供,也不构成TradingView提供或认可的任何形式的财务、投资、交易或其他类型的建议或推荐。请阅读使用条款了解更多信息。