Modern Dow Theory - Weekly Confirmation
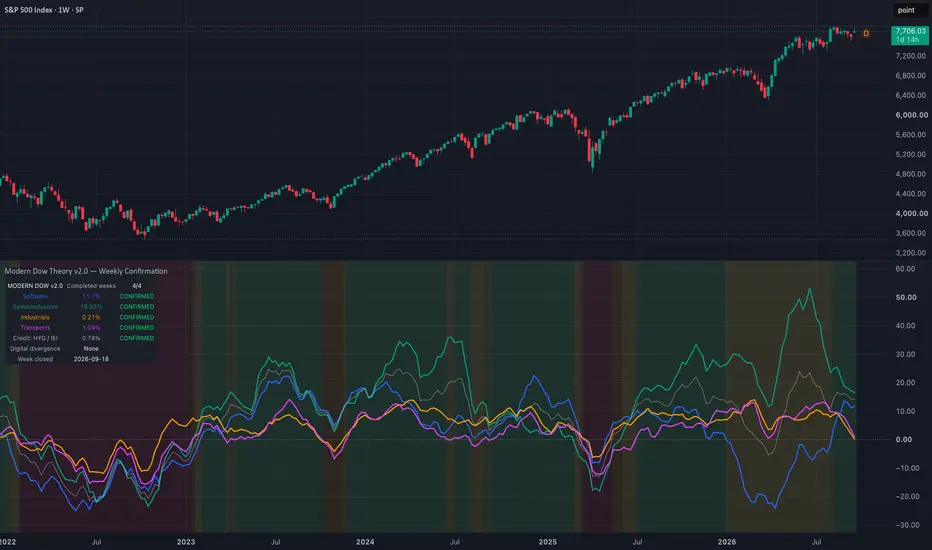
This indicator compares weekly participation across software, semiconductors, industrials and transports using IGV, SMH, XLI and IYT. Use a standard weekly or shorter chart.
Default readings are 100 × (three-week EMA of price / its 40-week SMA − 1). A sector confirms above its baseline. The optional breakout filter also requires the smoothed price to meet or exceed its preceding 26-week high. The background counts confirmations: green for four, yellow for three, orange for two and red for zero or one.
The digital line averages software and semiconductor readings equally. Separate credit context shows 100 × ((HYG / IEI) / its 20-week SMA − 1) without affecting the sector score. Alerts cover transitions into full confirmation, caution and disagreement between the digital sectors.
Results use the previous completed week on the SPX calendar by default and update when the next anchor week begins. Gaps can carry earlier values forward; the date checks the calendar, not each feed. This is descriptive sector context, not a tested trading strategy.
Default readings are 100 × (three-week EMA of price / its 40-week SMA − 1). A sector confirms above its baseline. The optional breakout filter also requires the smoothed price to meet or exceed its preceding 26-week high. The background counts confirmations: green for four, yellow for three, orange for two and red for zero or one.
The digital line averages software and semiconductor readings equally. Separate credit context shows 100 × ((HYG / IEI) / its 20-week SMA − 1) without affecting the sector score. Alerts cover transitions into full confirmation, caution and disagreement between the digital sectors.
Results use the previous completed week on the SPX calendar by default and update when the next anchor week begins. Gaps can carry earlier values forward; the date checks the calendar, not each feed. This is descriptive sector context, not a tested trading strategy.

免责声明
这些信息和出版物并非旨在提供,也不构成TradingView提供或认可的任何形式的财务、投资、交易或其他类型的建议或推荐。请阅读使用条款了解更多信息。
免责声明
这些信息和出版物并非旨在提供,也不构成TradingView提供或认可的任何形式的财务、投资、交易或其他类型的建议或推荐。请阅读使用条款了解更多信息。