已更新
[blackcat] L2 Fibonacci Bands
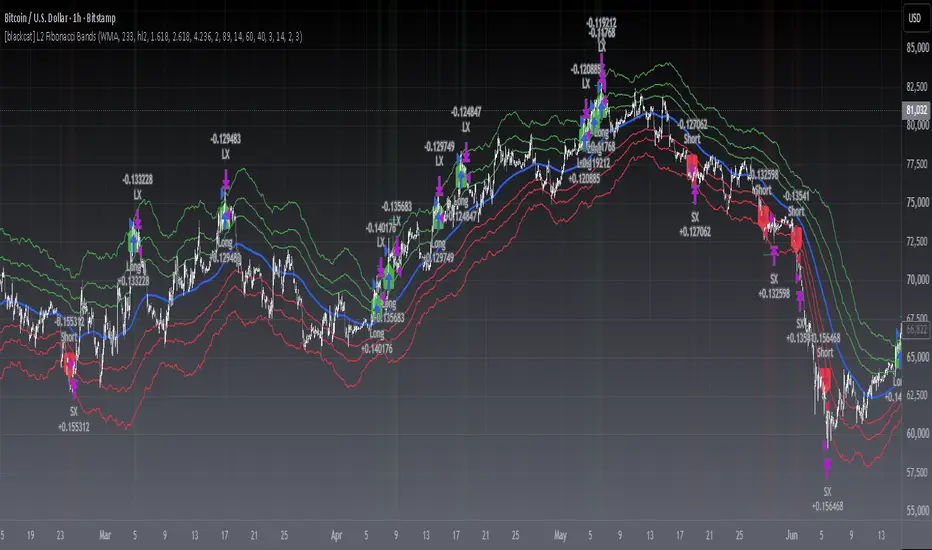
The concept of the Fibonacci Bands indicator was described by Suri Dudella in his book "Trade Chart Patterns Like the Pros" (Section 8.3, page 149). These bands are derived from Fibonacci expansions based on a fixed moving average, and they display potential areas of support and resistance. Traders can utilize the Fibonacci Bands indicator to identify key price levels and anticipate potential reversals in the market.
To calculate the Fibonacci Bands indicator, three Keltner Channels are applied. These channels help in determining the upper and lower boundaries of the bands. The default Fibonacci expansion levels used are 1.618, 2.618, and 4.236. These levels act as reference points for traders to identify significant areas of support and resistance.
When analyzing the price action, traders can focus on the extreme Fibonacci Bands, which are the upper and lower boundaries of the bands. If prices trade outside of the bands for a few bars and then return inside, it may indicate a potential reversal. This pattern suggests that the price has temporarily deviated from its usual range and could be due for a correction.
To enhance the accuracy of the Fibonacci Bands indicator, traders often use multiple time frames. By aligning short-term signals with the larger time frame scenario, traders can gain a better understanding of the overall market trend. It is generally advised to trade in the direction of the larger time frame to increase the probability of success.
In addition to identifying potential reversals, traders can also use the Fibonacci Bands indicator to determine entry and exit points. Short-term support and resistance levels can be derived from the bands, providing valuable insights for trade decision-making. These levels act as reference points for placing stop-loss orders or taking profits.
Another useful tool for analyzing the trend is the slope of the midband, which is the middle line of the Fibonacci Bands indicator. The midband's slope can indicate the strength and direction of the trend. Traders can monitor the slope to gain insights into the market's momentum and make informed trading decisions.
The Fibonacci Bands indicator is based on the concept of Fibonacci levels, which are support or resistance levels calculated using the Fibonacci sequence. The Fibonacci sequence is a mathematical pattern that follows a specific formula. A central concept within the Fibonacci sequence is the Golden Ratio, represented by the numbers 1.618 and its inverse 0.618. These ratios have been found to occur frequently in nature, architecture, and art.
The Italian mathematician Leonardo Fibonacci (1170-1250) is credited with introducing the Fibonacci sequence to the Western world. Fibonacci noticed that certain ratios could be calculated and that these ratios correspond to "divine ratios" found in various aspects of life. Traders have adopted these ratios in technical analysis to identify potential areas of support and resistance in financial markets.
In conclusion, the Fibonacci Bands indicator is a powerful tool for traders to identify potential reversals, determine entry and exit points, and analyze the overall trend. By combining the Fibonacci Bands with other technical indicators and using multiple time frames, traders can enhance their trading strategies and make more informed decisions in the market.
To calculate the Fibonacci Bands indicator, three Keltner Channels are applied. These channels help in determining the upper and lower boundaries of the bands. The default Fibonacci expansion levels used are 1.618, 2.618, and 4.236. These levels act as reference points for traders to identify significant areas of support and resistance.
When analyzing the price action, traders can focus on the extreme Fibonacci Bands, which are the upper and lower boundaries of the bands. If prices trade outside of the bands for a few bars and then return inside, it may indicate a potential reversal. This pattern suggests that the price has temporarily deviated from its usual range and could be due for a correction.
To enhance the accuracy of the Fibonacci Bands indicator, traders often use multiple time frames. By aligning short-term signals with the larger time frame scenario, traders can gain a better understanding of the overall market trend. It is generally advised to trade in the direction of the larger time frame to increase the probability of success.
In addition to identifying potential reversals, traders can also use the Fibonacci Bands indicator to determine entry and exit points. Short-term support and resistance levels can be derived from the bands, providing valuable insights for trade decision-making. These levels act as reference points for placing stop-loss orders or taking profits.
Another useful tool for analyzing the trend is the slope of the midband, which is the middle line of the Fibonacci Bands indicator. The midband's slope can indicate the strength and direction of the trend. Traders can monitor the slope to gain insights into the market's momentum and make informed trading decisions.
The Fibonacci Bands indicator is based on the concept of Fibonacci levels, which are support or resistance levels calculated using the Fibonacci sequence. The Fibonacci sequence is a mathematical pattern that follows a specific formula. A central concept within the Fibonacci sequence is the Golden Ratio, represented by the numbers 1.618 and its inverse 0.618. These ratios have been found to occur frequently in nature, architecture, and art.
The Italian mathematician Leonardo Fibonacci (1170-1250) is credited with introducing the Fibonacci sequence to the Western world. Fibonacci noticed that certain ratios could be calculated and that these ratios correspond to "divine ratios" found in various aspects of life. Traders have adopted these ratios in technical analysis to identify potential areas of support and resistance in financial markets.
In conclusion, the Fibonacci Bands indicator is a powerful tool for traders to identify potential reversals, determine entry and exit points, and analyze the overall trend. By combining the Fibonacci Bands with other technical indicators and using multiple time frames, traders can enhance their trading strategies and make more informed decisions in the market.
版本注释
█ OVERVIEWThis strategy layers Fibonacci expansion ratios on top of a Keltner-style volatility envelope to catch strong breakout moves in either direction. It combines band breakouts with RSI momentum confirmation, ATR-based take profit and stop loss levels, and full signal governance (cooldown, same-bar exclusivity, position state tracking).
█ STRATEGY CONCEPT
The script builds a Keltner Channel around a selectable moving average (SMA, EMA, WMA or HMA) of a configurable source, then expands the channel width with Fibonacci ratios (1.618 / 2.618 / 4.236 by default) to create three upper and three lower projection bands. Signals require price to cross beyond the outermost band while RSI confirms momentum, which filters out weak drifts and keeps entries aligned with strong directional pressure.
Core Principles
• Volatility envelope: Keltner Channel width adapts to market conditions
• Fibonacci expansion: 1.618 / 2.618 / 4.236 projections of the band width
• Momentum confirmation: RSI threshold gate on every entry
• Signal governance: cooldown, same-bar exclusivity and position state machine
█ ENTRY CONDITIONS
Long Entry
• Price crosses above the upper Fibonacci Band 3 (4.236 projection)
• RSI above the Long RSI Threshold (default 60)
• No long position active and cooldown has elapsed
Short Entry
• Price crosses below the lower Fibonacci Band 3 (4.236 projection)
• RSI below the Short RSI Threshold (default 40)
• No short position active and cooldown has elapsed
█ EXIT CONDITIONS
Take Profit / Stop Loss
• ATR-based levels placed automatically on every entry (2 x ATR stop, 3 x ATR target by default)
• Distances adapt to current volatility and stay comparable across symbols and timeframes
Signal Exit
• Long positions close when price crosses back under the midband
• Short positions close when price crosses back over the midband
█ RISK MANAGEMENT
• Default order size is 10% of equity; adjust to your risk budget
• Backtest models 0.1% commission and 2 ticks of slippage
• Position state machine prevents duplicate entries and same-bar contradictions
█ RECOMMENDED SETTINGS
• Timeframes: 1H and above; higher timeframes produce fewer, cleaner signals
• Markets: trending conditions on crypto, forex, futures or stocks
• Key inputs: MA Length (233), KC Length (89), Fibonacci levels, RSI thresholds, ATR multipliers
█ FEATURES
• Four moving average types (SMA / EMA / WMA / HMA) with configurable source
• Long and short signal toggles for long-only accounts
• Adjustable cooldown bars between signals
• Entry (E/S) and exit (XL/XS) labels, position background tint, live dashboard
• TradingView alerts on every entry and exit (bar close confirmed)
█ LIMITATIONS
• Breakout systems underperform in choppy, range-bound markets
• Outer-band signals are rare by design; expect a low trade count
• Past backtests are not indicative of future results; always forward test
════════════════════════════════════════════════════════════════════════
DISCLAIMER
Past performance is not a reliable indicator of future results.
This strategy is for educational purposes only.
Always backtest thoroughly before live trading.

Don't miss out! The first and most important thing to do is to join my Discord chat now! Click here to start your adventure: discord.com/invite/ZTGpQJq My new github for more pine development soon: github.com/wxt-coder
免责声明
这些信息和出版物并非旨在提供,也不构成TradingView提供或认可的任何形式的财务、投资、交易或其他类型的建议或推荐。请阅读使用条款了解更多信息。
Don't miss out! The first and most important thing to do is to join my Discord chat now! Click here to start your adventure: discord.com/invite/ZTGpQJq My new github for more pine development soon: github.com/wxt-coder
免责声明
这些信息和出版物并非旨在提供,也不构成TradingView提供或认可的任何形式的财务、投资、交易或其他类型的建议或推荐。请阅读使用条款了解更多信息。