OPEN-SOURCE SCRIPT
MTF Bias Table
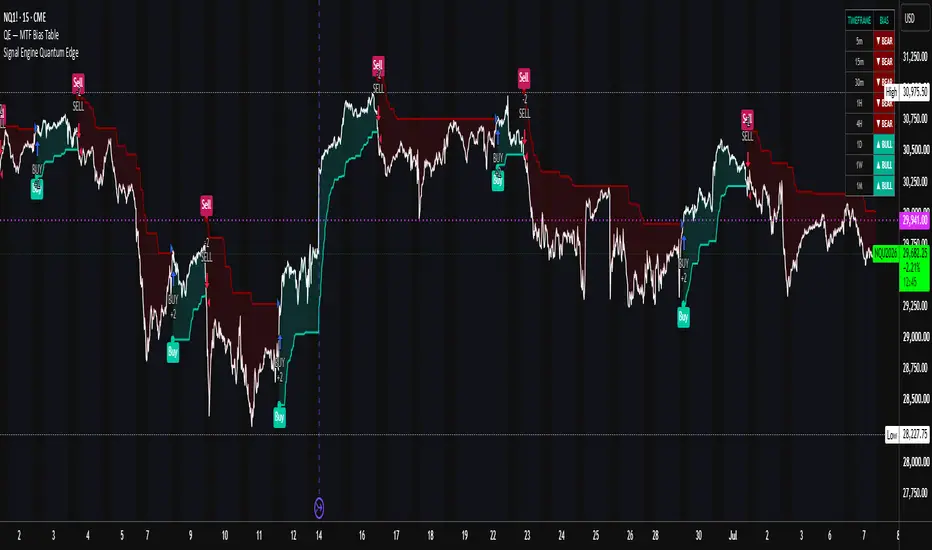
Script name
QE — MTF Bias Table
Short description
Multi‑timeframe trend bias dashboard. Compares fast vs. slow MA alignment across 5m through 1M to classify each timeframe as bullish or bearish at a glance.
Description
QE — MTF Bias Table is a non‑repainting, multi‑timeframe trend dashboard built for traders who need higher timeframe context before entering lower timeframe setups. It evaluates fast vs. slow moving average alignment across eight timeframes (5m, 15m, 30m, 1H, 4H, 1D, 1W, 1M) and prints a clean, color‑coded table directly on the chart.
The indicator is intentionally designed to pair with order‑flow, structure, and liquidity tools. It does not predict direction; it answers one question: “Is this timeframe aligned bullish or bearish?”
How it works
Fast MA > Slow MA = Bullish alignment (green “▲ BULL”)
Fast MA < Slow MA = Bearish alignment (red “▼ BEAR”)
All MTF requests use lookahead disabled to prevent repainting. The script reads a fresh close‑based value at each higher timeframe candle, so the bias state is stable and reflects the confirmed bar, not the developing one.
Configurable inputs
Fast MA Length (default 20)
Slow MA Length (default 50)
MA Type (EMA or SMA)
Why use this
Instantly see if your entry timeframe aligns with the daily/weekly bias
Avoid counter‑trend entries when the HTF is stacked against you
Use it as a filter: only trade setups that agree with the higher timeframe bias
Compact table design with minimal chart clutter
Tags
multi-timeframe
trend
bias
dashboard
Usage note
This is a bias filter, not an entry system. Combine it with your own structure, liquidity, and confirmation models for a complete trading plan.
QE — MTF Bias Table
Short description
Multi‑timeframe trend bias dashboard. Compares fast vs. slow MA alignment across 5m through 1M to classify each timeframe as bullish or bearish at a glance.
Description
QE — MTF Bias Table is a non‑repainting, multi‑timeframe trend dashboard built for traders who need higher timeframe context before entering lower timeframe setups. It evaluates fast vs. slow moving average alignment across eight timeframes (5m, 15m, 30m, 1H, 4H, 1D, 1W, 1M) and prints a clean, color‑coded table directly on the chart.
The indicator is intentionally designed to pair with order‑flow, structure, and liquidity tools. It does not predict direction; it answers one question: “Is this timeframe aligned bullish or bearish?”
How it works
Fast MA > Slow MA = Bullish alignment (green “▲ BULL”)
Fast MA < Slow MA = Bearish alignment (red “▼ BEAR”)
All MTF requests use lookahead disabled to prevent repainting. The script reads a fresh close‑based value at each higher timeframe candle, so the bias state is stable and reflects the confirmed bar, not the developing one.
Configurable inputs
Fast MA Length (default 20)
Slow MA Length (default 50)
MA Type (EMA or SMA)
Why use this
Instantly see if your entry timeframe aligns with the daily/weekly bias
Avoid counter‑trend entries when the HTF is stacked against you
Use it as a filter: only trade setups that agree with the higher timeframe bias
Compact table design with minimal chart clutter
Tags
multi-timeframe
trend
bias
dashboard
Usage note
This is a bias filter, not an entry system. Combine it with your own structure, liquidity, and confirmation models for a complete trading plan.
开源脚本
秉承TradingView的精神,该脚本的作者将其开源,以便交易者可以查看和验证其功能。向作者致敬!您可以免费使用该脚本,但请记住,重新发布代码须遵守我们的网站规则。

免责声明
这些信息和出版物并非旨在提供,也不构成TradingView提供或认可的任何形式的财务、投资、交易或其他类型的建议或推荐。请阅读使用条款了解更多信息。
开源脚本
秉承TradingView的精神,该脚本的作者将其开源,以便交易者可以查看和验证其功能。向作者致敬!您可以免费使用该脚本,但请记住,重新发布代码须遵守我们的网站规则。
免责声明
这些信息和出版物并非旨在提供,也不构成TradingView提供或认可的任何形式的财务、投资、交易或其他类型的建议或推荐。请阅读使用条款了解更多信息。