OPEN-SOURCE SCRIPT
OB + 2G2R + EMA/BB/ST/VWAP + Doji + Day Levels
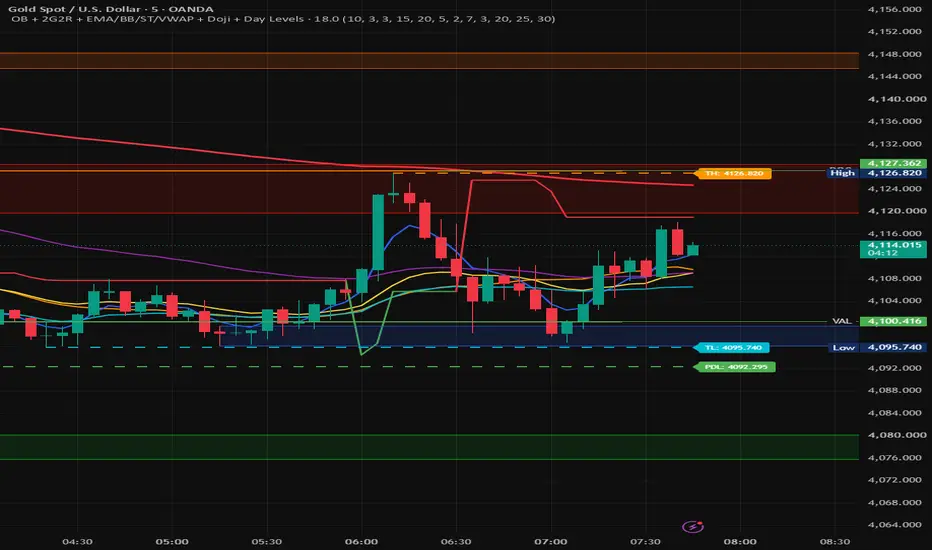
It is a multi-signal chart indicator. It does not place trades automatically; it plots trend tools, levels, and buy/sell markers.
It shows:
BB Mid — the 20-period SMA, used as the crossover reference.
EMA 5, EMA 20, EMA 50, EMA 200 — trend direction filters.
SuperTrend — green when bullish and red when bearish.
Today’s High and Today’s Low — running intraday high/low levels, updated as new candles form.
EMA BUY — EMA 5 crosses above BB Mid, the candle is bullish, and price is above EMA 20/50/200.
EMA SELL — EMA 5 crosses below BB Mid, the candle is bearish, and price is below EMA 20/50/200.
ST BUY / ST SELL — SuperTrend direction changes and the current candle breaks the previous candle’s high or low.
2R2G BUY — two bearish candles followed by two bullish candles.
2G2R SELL — two bullish candles followed by two bearish candles.
Doji Buy / Sell setups — a bullish-to-bearish or bearish-to-bullish two-candle sequence followed by a small-body doji.
The signals are independent. For example, a 2R2G marker does not require an EMA crossover or SuperTrend confirmation. The strongest practical use is to treat EMA trend, SuperTrend direction, and the candle pattern as confirmation together rather than entering on every marker.
It shows:
BB Mid — the 20-period SMA, used as the crossover reference.
EMA 5, EMA 20, EMA 50, EMA 200 — trend direction filters.
SuperTrend — green when bullish and red when bearish.
Today’s High and Today’s Low — running intraday high/low levels, updated as new candles form.
EMA BUY — EMA 5 crosses above BB Mid, the candle is bullish, and price is above EMA 20/50/200.
EMA SELL — EMA 5 crosses below BB Mid, the candle is bearish, and price is below EMA 20/50/200.
ST BUY / ST SELL — SuperTrend direction changes and the current candle breaks the previous candle’s high or low.
2R2G BUY — two bearish candles followed by two bullish candles.
2G2R SELL — two bullish candles followed by two bearish candles.
Doji Buy / Sell setups — a bullish-to-bearish or bearish-to-bullish two-candle sequence followed by a small-body doji.
The signals are independent. For example, a 2R2G marker does not require an EMA crossover or SuperTrend confirmation. The strongest practical use is to treat EMA trend, SuperTrend direction, and the candle pattern as confirmation together rather than entering on every marker.
开源脚本
秉承TradingView的精神,该脚本的作者将其开源,以便交易者可以查看和验证其功能。向作者致敬!您可以免费使用该脚本,但请记住,重新发布代码须遵守我们的网站规则。

免责声明
这些信息和出版物并非旨在提供,也不构成TradingView提供或认可的任何形式的财务、投资、交易或其他类型的建议或推荐。请阅读使用条款了解更多信息。
免责声明
这些信息和出版物并非旨在提供,也不构成TradingView提供或认可的任何形式的财务、投资、交易或其他类型的建议或推荐。请阅读使用条款了解更多信息。