OPEN-SOURCE SCRIPT
CVD v2 (Cumulative Volume Delta) + Divergences
🇬🇧 ENGLISH
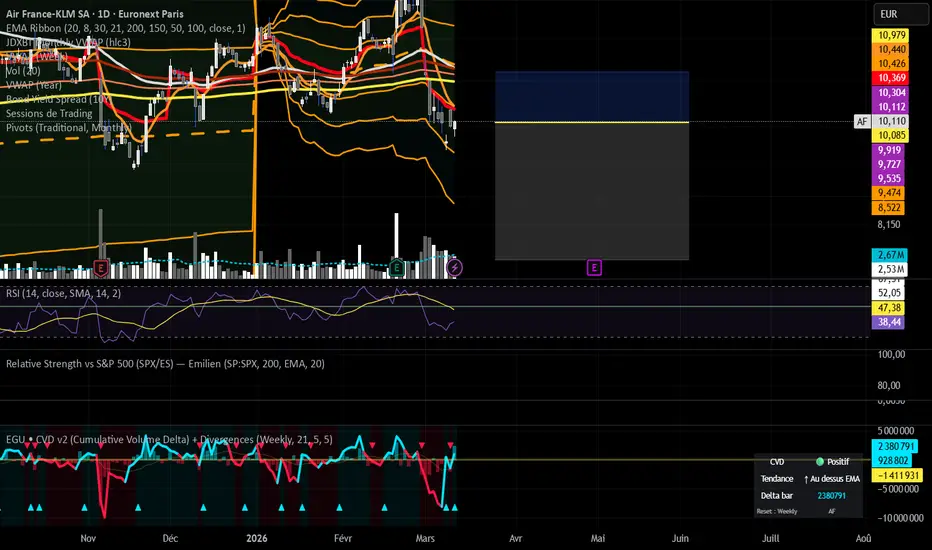
EGU • CVD v2 (Cumulative Volume Delta + Divergences)
The CVD (Cumulative Volume Delta) is an advanced volume indicator that measures in real time the battle between buyers and sellers, bar by bar, by accumulating the volume delta over a defined period.
Unlike classic momentum indicators such as RSI which only analyze price, the CVD analyzes who is truly pushing the market — buyers or sellers — by weighting volume according to the close position within each candle.
Features :
Bar-by-bar delta histogram (instant buying/selling pressure)
Cumulative CVD line with dynamic color based on trend direction
Adjustable CVD EMA to smooth the signal
Automatic detection of bullish and bearish divergences with line drawing
Built-in alerts on divergences and zero-line crossovers
Configurable reset : Never / Weekly / Monthly
Real-time information table (CVD state, trend, current bar delta)
Background coloring based on positive/negative CVD zone
How to use it :
Use CVD divergences in confluence with your Supply & Demand zones to confirm momentum exhaustion before entering a trade
Combine with the RSI : a divergence on both indicators simultaneously is a very strong signal
The zero-line crossover signals a shift in dominance between buyers and sellers
Choose your reset according to your trading style : Weekly for short swing trades (3–14 days), Monthly for longer positions
Recommended settings :
Short swing trading (few days) → Weekly reset, EMA 21
Medium swing trading (2–4 weeks) → Monthly reset, EMA 21
Script created by EGU
开源脚本
秉承TradingView的精神,该脚本的作者将其开源,以便交易者可以查看和验证其功能。向作者致敬!您可以免费使用该脚本,但请记住,重新发布代码须遵守我们的网站规则。

免责声明
这些信息和出版物并非旨在提供,也不构成TradingView提供或认可的任何形式的财务、投资、交易或其他类型的建议或推荐。请阅读使用条款了解更多信息。
免责声明
这些信息和出版物并非旨在提供,也不构成TradingView提供或认可的任何形式的财务、投资、交易或其他类型的建议或推荐。请阅读使用条款了解更多信息。