OPEN-SOURCE SCRIPT
ShareScope Weiss Wave approximation
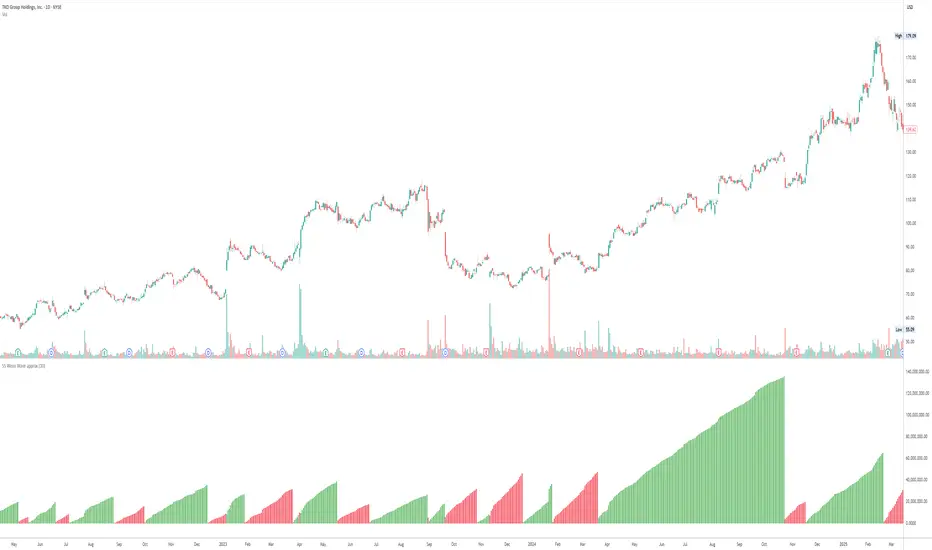
ShareScope Weiss Wave approximation
This TradingView script is intended to provide a close visual approximation of the ShareScope Weis/Weiss Wave indicator. It is not an exact clone because ShareScope's proprietary source code is not known.
It has been prepared to facilitate comparison of several Weiss Waves against one another with different ZigZag values.
The indicator uses a configurable percentage ZigZag-style reversal threshold to define each wave, then accumulates volume during the active wave. When a new wave is confirmed, cumulative volume resets and a new wave-volume sequence begins.
The ZigZag Value (%) controls how much price must reverse before a new wave begins. The default value is 10%, matching the commonly observed ShareScope default.
ShareScope's suggested settings, comments and starting values:
Daily swing trading: 3–5%
Daily active/tactical: 2–3%
Weekly: 5–8%
Intraday 5-minute/hourly: 0.5–1.5%
UK mid-cap/AIM daily charts: often 5–7%
Large liquid FTSE 100 stocks: often 3–4%
Use High/Low is enabled by default. This uses the full candle high/low range and is intended to better capture true price extremes and turning points. If disabled, the script uses close-only logic, which is smoother but may miss intrabar extremes.
Symmetric Calculation is normally left OFF to remain closer to standard Weis Wave-style interpretation.
The practical purpose of this script is visual comparison. For example, users can apply two instances of the indicator to the same TradingView chart with different ZigZag percentage values, such as 10% and 4%, and compare how the wave structure changes against another indicator such as a stochastic curve.
Important caveat: because the exact ShareScope calculation engine is not public, this script should be treated as an approximation for visual study, not a guaranteed replication of ShareScope's historical or live Weis/Weiss Wave engine.
This TradingView script is intended to provide a close visual approximation of the ShareScope Weis/Weiss Wave indicator. It is not an exact clone because ShareScope's proprietary source code is not known.
It has been prepared to facilitate comparison of several Weiss Waves against one another with different ZigZag values.
The indicator uses a configurable percentage ZigZag-style reversal threshold to define each wave, then accumulates volume during the active wave. When a new wave is confirmed, cumulative volume resets and a new wave-volume sequence begins.
The ZigZag Value (%) controls how much price must reverse before a new wave begins. The default value is 10%, matching the commonly observed ShareScope default.
ShareScope's suggested settings, comments and starting values:
Daily swing trading: 3–5%
Daily active/tactical: 2–3%
Weekly: 5–8%
Intraday 5-minute/hourly: 0.5–1.5%
UK mid-cap/AIM daily charts: often 5–7%
Large liquid FTSE 100 stocks: often 3–4%
Use High/Low is enabled by default. This uses the full candle high/low range and is intended to better capture true price extremes and turning points. If disabled, the script uses close-only logic, which is smoother but may miss intrabar extremes.
Symmetric Calculation is normally left OFF to remain closer to standard Weis Wave-style interpretation.
The practical purpose of this script is visual comparison. For example, users can apply two instances of the indicator to the same TradingView chart with different ZigZag percentage values, such as 10% and 4%, and compare how the wave structure changes against another indicator such as a stochastic curve.
Important caveat: because the exact ShareScope calculation engine is not public, this script should be treated as an approximation for visual study, not a guaranteed replication of ShareScope's historical or live Weis/Weiss Wave engine.
开源脚本
秉承TradingView的精神,该脚本的作者将其开源,以便交易者可以查看和验证其功能。向作者致敬!您可以免费使用该脚本,但请记住,重新发布代码须遵守我们的网站规则。

免责声明
这些信息和出版物并非旨在提供,也不构成TradingView提供或认可的任何形式的财务、投资、交易或其他类型的建议或推荐。请阅读使用条款了解更多信息。
开源脚本
秉承TradingView的精神,该脚本的作者将其开源,以便交易者可以查看和验证其功能。向作者致敬!您可以免费使用该脚本,但请记住,重新发布代码须遵守我们的网站规则。
免责声明
这些信息和出版物并非旨在提供,也不构成TradingView提供或认可的任何形式的财务、投资、交易或其他类型的建议或推荐。请阅读使用条款了解更多信息。