OPEN-SOURCE SCRIPT
Darwin 40-40 Midline
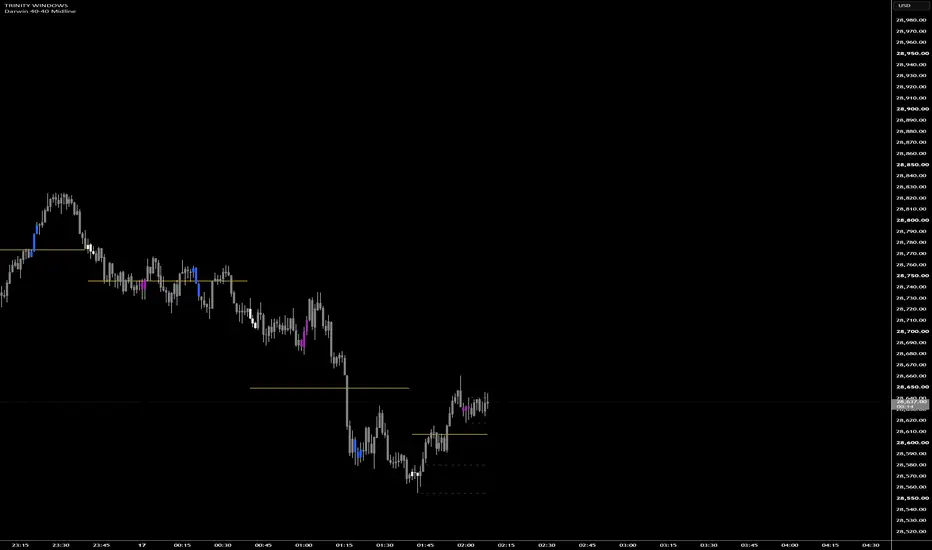
The Darwin 40-40 Midline is a custom overlay indicator designed to track and display a dynamic midpoint of price action, anchoring to a specific time interval. Rather than using standard hourly or daily resets, this script resets its tracking specifically at the 40th minute of every hour, providing a unique intra-hour perspective on price equilibrium.
How It Works (The Logic)
This indicator utilizes a dynamic high/low range calculation to plot a continuous midline:
The Reset: The script monitors the timestamp of each bar. As soon as the time hits the 40th minute of the hour (e.g., 09:40, 10:40, 11:40), the indicator resets its internal high and low anchor points to the high and low of that specific bar.
The Dynamic Midpoint: For every subsequent bar following the 40-minute mark, the script checks if price has broken the anchored high or low. If a new high or low is established, the range is updated.
The Plot: The indicator dynamically draws a line at the exact mathematical center of this expanding range (Highest High + Lowest Low) / 2. The line extends forward with each new bar, visually adjusting its level in real-time as the range expands.
How to Use It
Traders often use dynamic midpoints as shifting zones of support, resistance, or trend bias:
Trend Bias: When the price sustains itself above the active midline, the intra-hour bias can be interpreted as bullish. Conversely, trading below the midline suggests a bearish bias.
Mean Reversion: In ranging environments, extended moves away from the midline might be viewed as overextended, with the midline acting as a natural magnet for mean-reversion trades.
Breakouts: A sudden expansion of the range (which shifts the midline drastically) can highlight increasing volatility and potential breakout direction following the 40-minute reset.
Settings & Customization
The indicator includes a dedicated "Midline Settings" group in the configuration menu, allowing users to fully customize the visual appearance of the line to fit any chart theme. Users can adjust:
Midline Color: Change the color of the dynamic line (defaults to yellow).
Midline Width: Adjust the thickness of the line (1 to 5).
Style: Choose between Solid, Dashed, or Dotted line styles.
happy Trading!!!!
How It Works (The Logic)
This indicator utilizes a dynamic high/low range calculation to plot a continuous midline:
The Reset: The script monitors the timestamp of each bar. As soon as the time hits the 40th minute of the hour (e.g., 09:40, 10:40, 11:40), the indicator resets its internal high and low anchor points to the high and low of that specific bar.
The Dynamic Midpoint: For every subsequent bar following the 40-minute mark, the script checks if price has broken the anchored high or low. If a new high or low is established, the range is updated.
The Plot: The indicator dynamically draws a line at the exact mathematical center of this expanding range (Highest High + Lowest Low) / 2. The line extends forward with each new bar, visually adjusting its level in real-time as the range expands.
How to Use It
Traders often use dynamic midpoints as shifting zones of support, resistance, or trend bias:
Trend Bias: When the price sustains itself above the active midline, the intra-hour bias can be interpreted as bullish. Conversely, trading below the midline suggests a bearish bias.
Mean Reversion: In ranging environments, extended moves away from the midline might be viewed as overextended, with the midline acting as a natural magnet for mean-reversion trades.
Breakouts: A sudden expansion of the range (which shifts the midline drastically) can highlight increasing volatility and potential breakout direction following the 40-minute reset.
Settings & Customization
The indicator includes a dedicated "Midline Settings" group in the configuration menu, allowing users to fully customize the visual appearance of the line to fit any chart theme. Users can adjust:
Midline Color: Change the color of the dynamic line (defaults to yellow).
Midline Width: Adjust the thickness of the line (1 to 5).
Style: Choose between Solid, Dashed, or Dotted line styles.
happy Trading!!!!
开源脚本
秉承TradingView的精神,该脚本的作者将其开源,以便交易者可以查看和验证其功能。向作者致敬!您可以免费使用该脚本,但请记住,重新发布代码须遵守我们的网站规则。

*PM me after for access.*
免责声明
这些信息和出版物并非旨在提供,也不构成TradingView提供或认可的任何形式的财务、投资、交易或其他类型的建议或推荐。请阅读使用条款了解更多信息。
开源脚本
秉承TradingView的精神,该脚本的作者将其开源,以便交易者可以查看和验证其功能。向作者致敬!您可以免费使用该脚本,但请记住,重新发布代码须遵守我们的网站规则。
*PM me after for access.*
免责声明
这些信息和出版物并非旨在提供,也不构成TradingView提供或认可的任何形式的财务、投资、交易或其他类型的建议或推荐。请阅读使用条款了解更多信息。