已更新
PDH+PDL+Session Highs and Lows_MarkAlex
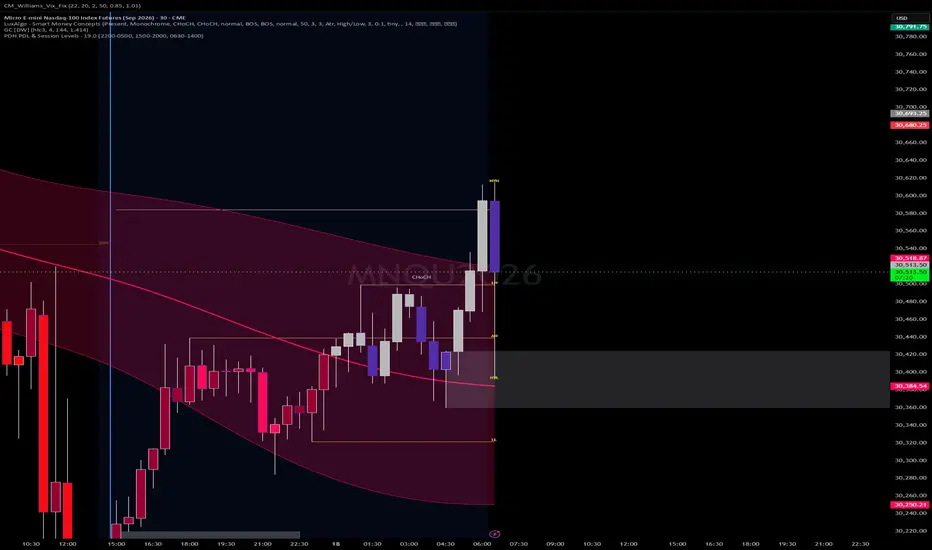
"PDH/PDL & Session Levels"
A clean multi-timeframe levels indicator that plots two types of horizontal reference lines anchored to their source candles and extending to the current bar:
Daily/Weekly/Monthly Levels — Draws the previous day high and low, previous week high and low, and the current daily, weekly, and monthly open prices as color-coded horizontal lines. Each line originates from the first bar of the current period and stretches to the current candle so you always see exactly how far price has traveled from those key levels. All seven levels are individually toggleable with custom colors.
Session Highs & Lows — Tracks the highest and lowest wick printed during each of the three major trading sessions — Asia (1pm–5pm MT), London (1am–6am MT), and New York (6:30am–3pm MT) — and draws a horizontal line anchored to the exact candle that made that high or low, extending to the current bar. Shows the last two occurrences of each session so you can compare back-to-back sessions. The most recent session is full color, the previous one is faded. All three sessions are individually toggleable with custom colors.
版本注释
++ lower time frames
免责声明
这些信息和出版物并非旨在提供,也不构成TradingView提供或认可的任何形式的财务、投资、交易或其他类型的建议或推荐。请阅读使用条款了解更多信息。
免责声明
这些信息和出版物并非旨在提供,也不构成TradingView提供或认可的任何形式的财务、投资、交易或其他类型的建议或推荐。请阅读使用条款了解更多信息。