OPEN-SOURCE SCRIPT
Correlated Sine Oscillator [LuxAlgo]
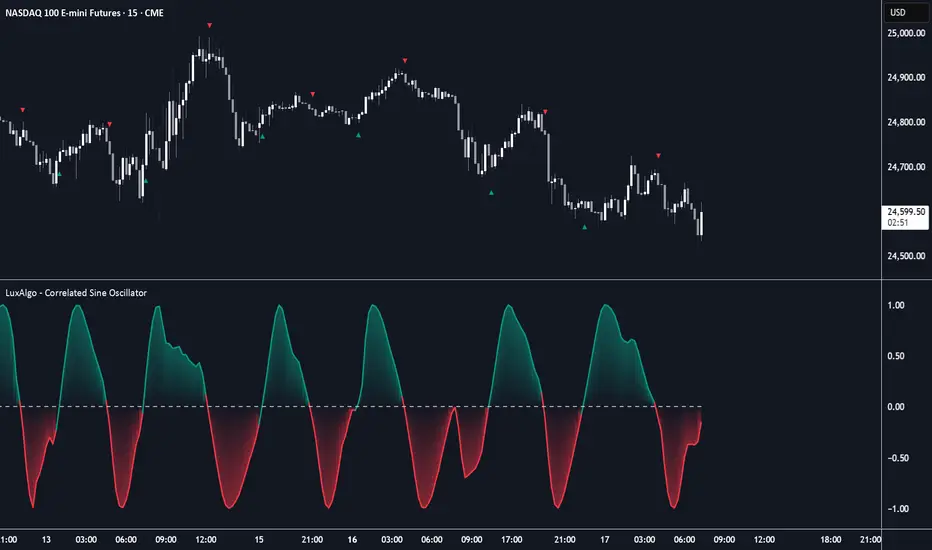
The Correlated Sine Oscillator indicator identifies and isolates cyclical components within price action to generate a normalized, phase-aligned sinusoid that fluctuates between -1 and 1.
🔶 USAGE
The Correlated Sine Oscillator is designed to help traders visualize the underlying rhythm of the market by projecting price data onto a mathematical sine wave. Unlike standard momentum oscillators, this tool uses quadrature components to determine the current "phase" of the market cycle, allowing the oscillator to stay synced with price swings.
🔹 Identifying Cycle Direction
The oscillator fluctuates within a fixed range of -1 to 1, centered around a zero line. Signals are generated based on the crossing of this midpoint to identify shifts in the dominant cycle.
🔹 The Phase Multiplier
The Phase Multiplier setting is a unique feature that controls how responsively the oscillator adapts to changes in price direction. Since the indicator uses an average of the real and imaginary components to find the phase, increasing this multiplier will result in a smoother, more stable oscillator that is less prone to noise but slightly more lagging. Lowering the multiplier makes the oscillator react faster to price shifts, which can be useful for identifying quick reversals.
🔶 DETAILS
The construction of the Correlated Sine Oscillator follows a sophisticated signal processing workflow:
🔶 SETTINGS
🔶 USAGE
The Correlated Sine Oscillator is designed to help traders visualize the underlying rhythm of the market by projecting price data onto a mathematical sine wave. Unlike standard momentum oscillators, this tool uses quadrature components to determine the current "phase" of the market cycle, allowing the oscillator to stay synced with price swings.
🔹 Identifying Cycle Direction
The oscillator fluctuates within a fixed range of -1 to 1, centered around a zero line. Signals are generated based on the crossing of this midpoint to identify shifts in the dominant cycle.
- Bullish Signals: When the oscillator crosses above the zero line, a bullish triangle (▲) appears below the price bar, signaling the start of a rising phase in the cycle.
- Bearish Signals: When the oscillator crosses below the zero line, a bearish triangle (▼) appears above the price bar, signaling the start of a falling phase in the cycle.
- Cycle Extremes: While signals occur at the midline, values approaching 1 or -1 represent the peak and trough of the identified cycle, respectively.
🔹 The Phase Multiplier
The Phase Multiplier setting is a unique feature that controls how responsively the oscillator adapts to changes in price direction. Since the indicator uses an average of the real and imaginary components to find the phase, increasing this multiplier will result in a smoother, more stable oscillator that is less prone to noise but slightly more lagging. Lowering the multiplier makes the oscillator react faster to price shifts, which can be useful for identifying quick reversals.
🔶 DETAILS
The construction of the Correlated Sine Oscillator follows a sophisticated signal processing workflow:
- Detrending: The script first removes the trend by subtracting a Simple Moving Average (SMA) from the closing price. This isolates the high-frequency fluctuations (cycles) around a mean of zero.
- Quadrature Projection: The detrended price is projected onto both a Sine and Cosine wave (real and imaginary components) based on the user-defined Cycle Period.
- Phase Estimation: By calculating the arctangent of these components, the script derives the "Dynamic Phase." This tells us exactly where the current price sits within the theoretical cycle.
- Correlation: Finally, the script generates a synthetic sine wave that is shifted by the calculated phase, ensuring the output is perfectly correlated with the dominant frequency of the price action.
🔶 SETTINGS
- Cycle Period: Determines the primary wavelength (in bars) that the indicator looks for in the price data. Setting this to 20 means the oscillator is tuned to find cycles that repeat every 20 bars.
- Phase Multiplier: A multiplier applied to the Cycle Period to determine the smoothing length of the internal phase components. A higher value leads to a "cleaner" wave, while a lower value follows price more aggressively.
- Bullish Color: Controls the color of the oscillator and gradient fill when the value is above zero.
- Bearish Color: Controls the color of the oscillator and gradient fill when the value is below zero.
开源脚本
秉承TradingView的精神,该脚本的作者将其开源,以便交易者可以查看和验证其功能。向作者致敬!您可以免费使用该脚本,但请记住,重新发布代码须遵守我们的网站规则。

Build your own edge with AI: luxalgo.com
All content provided by LuxAlgo is for informational & educational purposes only. Past performance does not guarantee future results.
All content provided by LuxAlgo is for informational & educational purposes only. Past performance does not guarantee future results.
免责声明
这些信息和出版物并非旨在提供,也不构成TradingView提供或认可的任何形式的财务、投资、交易或其他类型的建议或推荐。请阅读使用条款了解更多信息。
开源脚本
秉承TradingView的精神,该脚本的作者将其开源,以便交易者可以查看和验证其功能。向作者致敬!您可以免费使用该脚本,但请记住,重新发布代码须遵守我们的网站规则。
Build your own edge with AI: luxalgo.com
All content provided by LuxAlgo is for informational & educational purposes only. Past performance does not guarantee future results.
All content provided by LuxAlgo is for informational & educational purposes only. Past performance does not guarantee future results.
免责声明
这些信息和出版物并非旨在提供,也不构成TradingView提供或认可的任何形式的财务、投资、交易或其他类型的建议或推荐。请阅读使用条款了解更多信息。